Zip Codes with the Highest Percentage of Population Employed in Transportation & Warehousing in Oklahoma
RELATED REPORTS & OPTIONS
Transportation & Warehousing
Oklahoma
Compare Zip Codes
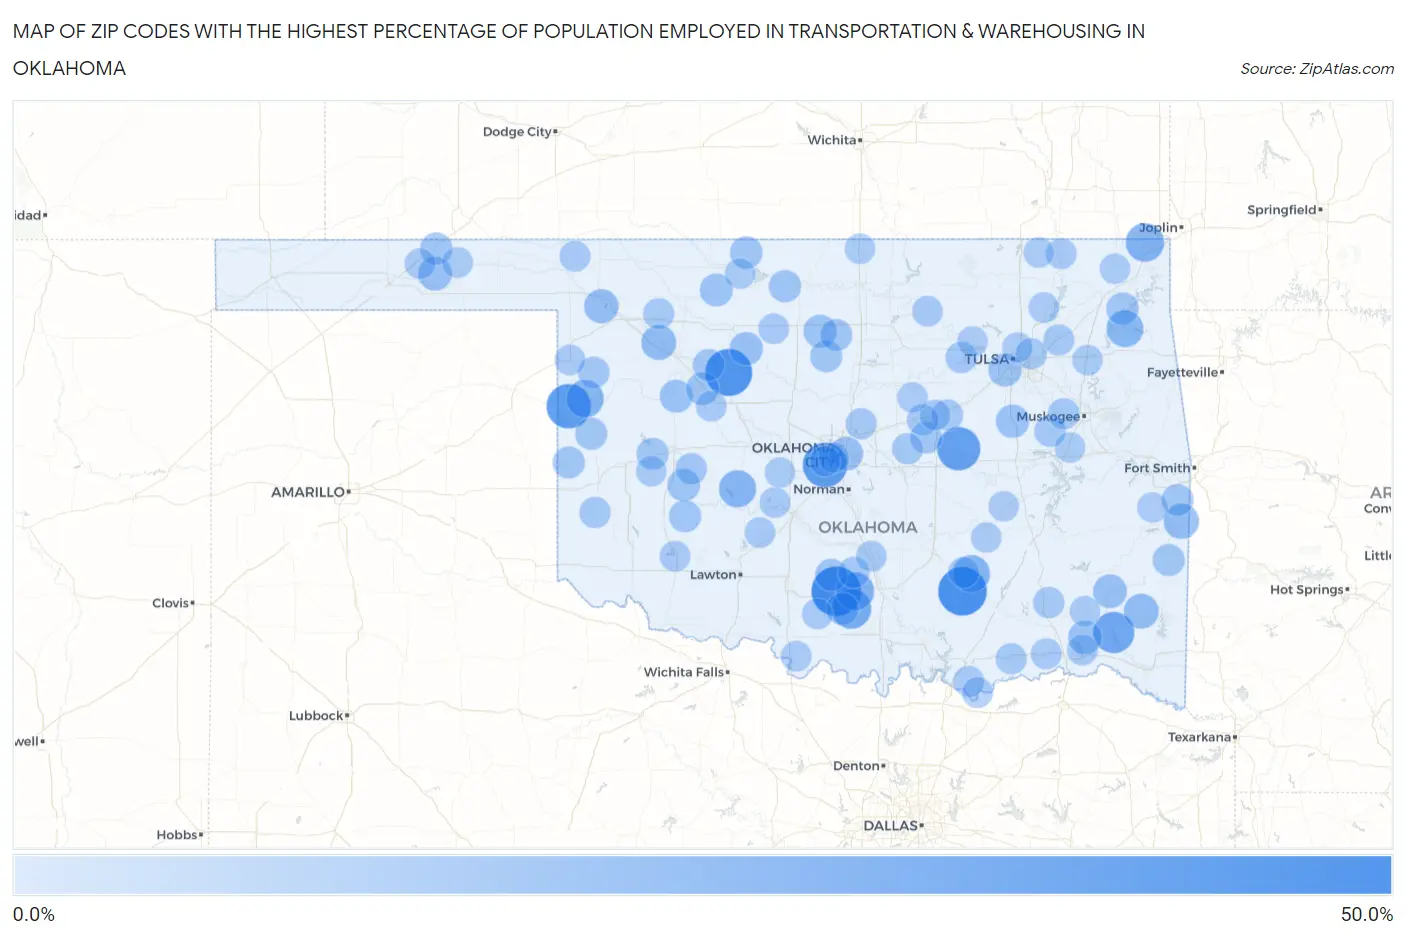
Map of Zip Codes with the Highest Percentage of Population Employed in Transportation & Warehousing in Oklahoma
0.0%
50.0%
Zip Codes with the Highest Percentage of Population Employed in Transportation & Warehousing in Oklahoma
| Zip Code | % Employed | vs State | vs National | |
| 1. | 73488 | 50.0% | 4.5%(+45.5)#1 | 4.9%(+45.1)#81 |
| 2. | 74535 | 47.8% | 4.5%(+43.4)#2 | 4.9%(+42.9)#88 |
| 3. | 73770 | 44.4% | 4.5%(+40.0)#3 | 4.9%(+39.5)#107 |
| 4. | 73097 | 38.7% | 4.5%(+34.2)#4 | 4.9%(+33.7)#139 |
| 5. | 73642 | 38.6% | 4.5%(+34.1)#5 | 4.9%(+33.7)#141 |
| 6. | 74829 | 35.9% | 4.5%(+31.4)#6 | 4.9%(+30.9)#161 |
| 7. | 74754 | 31.4% | 4.5%(+26.9)#7 | 4.9%(+26.5)#208 |
| 8. | 73437 | 28.6% | 4.5%(+24.1)#8 | 4.9%(+23.6)#257 |
| 9. | 74360 | 25.0% | 4.5%(+20.5)#9 | 4.9%(+20.1)#338 |
| 10. | 73444 | 24.7% | 4.5%(+20.2)#10 | 4.9%(+19.7)#343 |
| 11. | 73638 | 23.2% | 4.5%(+18.7)#11 | 4.9%(+18.2)#388 |
| 12. | 74534 | 22.9% | 4.5%(+18.4)#12 | 4.9%(+17.9)#400 |
| 13. | 73001 | 22.2% | 4.5%(+17.7)#13 | 4.9%(+17.3)#428 |
| 14. | 74366 | 21.5% | 4.5%(+17.0)#14 | 4.9%(+16.6)#453 |
| 15. | 74947 | 18.2% | 4.5%(+13.7)#15 | 4.9%(+13.2)#668 |
| 16. | 73853 | 17.5% | 4.5%(+13.1)#16 | 4.9%(+12.6)#720 |
| 17. | 74724 | 17.5% | 4.5%(+13.0)#17 | 4.9%(+12.5)#726 |
| 18. | 73841 | 16.1% | 4.5%(+11.6)#18 | 4.9%(+11.1)#900 |
| 19. | 73117 | 15.1% | 4.5%(+10.6)#19 | 4.9%(+10.2)#1,035 |
| 20. | 74558 | 15.0% | 4.5%(+10.5)#20 | 4.9%(+10.0)#1,074 |
| 21. | 73901 | 14.9% | 4.5%(+10.4)#21 | 4.9%(+9.95)#1,088 |
| 22. | 74760 | 14.5% | 4.5%(+10.1)#22 | 4.9%(+9.60)#1,157 |
| 23. | 73747 | 14.2% | 4.5%(+9.69)#23 | 4.9%(+9.22)#1,245 |
| 24. | 74456 | 14.0% | 4.5%(+9.48)#24 | 4.9%(+9.01)#1,295 |
| 25. | 74050 | 13.6% | 4.5%(+9.16)#25 | 4.9%(+8.69)#1,365 |
| 26. | 73736 | 13.4% | 4.5%(+8.97)#26 | 4.9%(+8.50)#1,406 |
| 27. | 73659 | 13.3% | 4.5%(+8.86)#27 | 4.9%(+8.39)#1,443 |
| 28. | 73731 | 13.2% | 4.5%(+8.73)#28 | 4.9%(+8.26)#1,478 |
| 29. | 73632 | 12.7% | 4.5%(+8.24)#29 | 4.9%(+7.77)#1,620 |
| 30. | 73658 | 12.5% | 4.5%(+8.02)#30 | 4.9%(+7.55)#1,677 |
| 31. | 74349 | 12.3% | 4.5%(+7.80)#31 | 4.9%(+7.33)#1,759 |
| 32. | 73951 | 12.2% | 4.5%(+7.68)#32 | 4.9%(+7.21)#1,796 |
| 33. | 73722 | 12.2% | 4.5%(+7.68)#33 | 4.9%(+7.21)#1,798 |
| 34. | 73435 | 12.0% | 4.5%(+7.52)#34 | 4.9%(+7.05)#1,858 |
| 35. | 73434 | 11.9% | 4.5%(+7.43)#35 | 4.9%(+6.96)#1,902 |
| 36. | 73761 | 11.8% | 4.5%(+7.34)#36 | 4.9%(+6.87)#1,937 |
| 37. | 73041 | 11.4% | 4.5%(+6.97)#37 | 4.9%(+6.50)#2,096 |
| 38. | 74939 | 11.4% | 4.5%(+6.89)#38 | 4.9%(+6.42)#2,138 |
| 39. | 73056 | 11.4% | 4.5%(+6.88)#39 | 4.9%(+6.41)#2,146 |
| 40. | 73628 | 11.3% | 4.5%(+6.78)#40 | 4.9%(+6.31)#2,203 |
| 41. | 73730 | 11.2% | 4.5%(+6.76)#41 | 4.9%(+6.29)#2,214 |
| 42. | 73666 | 11.2% | 4.5%(+6.72)#42 | 4.9%(+6.25)#2,236 |
| 43. | 73755 | 11.1% | 4.5%(+6.59)#43 | 4.9%(+6.12)#2,293 |
| 44. | 73647 | 11.0% | 4.5%(+6.54)#44 | 4.9%(+6.07)#2,315 |
| 45. | 74869 | 10.9% | 4.5%(+6.47)#45 | 4.9%(+6.00)#2,345 |
| 46. | 74932 | 10.7% | 4.5%(+6.20)#46 | 4.9%(+5.73)#2,486 |
| 47. | 73832 | 10.3% | 4.5%(+5.83)#47 | 4.9%(+5.36)#2,705 |
| 48. | 73024 | 10.0% | 4.5%(+5.48)#48 | 4.9%(+5.01)#2,923 |
| 49. | 74422 | 9.9% | 4.5%(+5.45)#49 | 4.9%(+4.97)#2,940 |
| 50. | 74081 | 9.8% | 4.5%(+5.37)#50 | 4.9%(+4.90)#2,989 |
| 51. | 74463 | 9.8% | 4.5%(+5.33)#51 | 4.9%(+4.86)#3,009 |
| 52. | 73433 | 9.6% | 4.5%(+5.14)#52 | 4.9%(+4.67)#3,147 |
| 53. | 73673 | 9.6% | 4.5%(+5.14)#53 | 4.9%(+4.67)#3,151 |
| 54. | 74557 | 9.6% | 4.5%(+5.12)#54 | 4.9%(+4.65)#3,170 |
| 55. | 74046 | 9.5% | 4.5%(+5.05)#55 | 4.9%(+4.58)#3,217 |
| 56. | 74026 | 9.5% | 4.5%(+5.02)#56 | 4.9%(+4.55)#3,241 |
| 57. | 73852 | 9.3% | 4.5%(+4.86)#57 | 4.9%(+4.39)#3,370 |
| 58. | 74855 | 9.2% | 4.5%(+4.73)#58 | 4.9%(+4.26)#3,480 |
| 59. | 74116 | 9.1% | 4.5%(+4.65)#59 | 4.9%(+4.18)#3,568 |
| 60. | 74019 | 9.0% | 4.5%(+4.57)#60 | 4.9%(+4.09)#3,663 |
| 61. | 73007 | 9.0% | 4.5%(+4.56)#61 | 4.9%(+4.09)#3,667 |
| 62. | 74723 | 9.0% | 4.5%(+4.54)#62 | 4.9%(+4.06)#3,687 |
| 63. | 74572 | 8.9% | 4.5%(+4.45)#63 | 4.9%(+3.98)#3,780 |
| 64. | 74759 | 8.9% | 4.5%(+4.39)#64 | 4.9%(+3.91)#3,859 |
| 65. | 73855 | 8.8% | 4.5%(+4.30)#65 | 4.9%(+3.83)#3,964 |
| 66. | 73945 | 8.7% | 4.5%(+4.26)#66 | 4.9%(+3.79)#4,001 |
| 67. | 74756 | 8.7% | 4.5%(+4.19)#67 | 4.9%(+3.72)#4,083 |
| 68. | 73559 | 8.6% | 4.5%(+4.16)#68 | 4.9%(+3.69)#4,113 |
| 69. | 74720 | 8.6% | 4.5%(+4.13)#69 | 4.9%(+3.66)#4,150 |
| 70. | 73442 | 8.6% | 4.5%(+4.13)#70 | 4.9%(+3.66)#4,151 |
| 71. | 73950 | 8.6% | 4.5%(+4.12)#71 | 4.9%(+3.65)#4,158 |
| 72. | 73075 | 8.5% | 4.5%(+4.01)#72 | 4.9%(+3.54)#4,290 |
| 73. | 74747 | 8.5% | 4.5%(+3.99)#73 | 4.9%(+3.52)#4,315 |
| 74. | 74650 | 8.4% | 4.5%(+3.94)#74 | 4.9%(+3.47)#4,371 |
| 75. | 73092 | 8.4% | 4.5%(+3.92)#75 | 4.9%(+3.45)#4,394 |
| 76. | 73754 | 8.4% | 4.5%(+3.89)#76 | 4.9%(+3.42)#4,426 |
| 77. | 73029 | 8.3% | 4.5%(+3.87)#77 | 4.9%(+3.40)#4,445 |
| 78. | 73565 | 8.3% | 4.5%(+3.83)#78 | 4.9%(+3.36)#4,509 |
| 79. | 74079 | 8.2% | 4.5%(+3.76)#79 | 4.9%(+3.29)#4,591 |
| 80. | 74042 | 8.2% | 4.5%(+3.76)#80 | 4.9%(+3.29)#4,598 |
| 81. | 73646 | 8.2% | 4.5%(+3.69)#81 | 4.9%(+3.22)#4,678 |
| 82. | 73624 | 8.2% | 4.5%(+3.68)#82 | 4.9%(+3.21)#4,694 |
| 83. | 73858 | 8.1% | 4.5%(+3.65)#83 | 4.9%(+3.18)#4,722 |
| 84. | 74543 | 8.0% | 4.5%(+3.57)#84 | 4.9%(+3.10)#4,830 |
| 85. | 74459 | 8.0% | 4.5%(+3.52)#85 | 4.9%(+3.05)#4,898 |
| 86. | 73108 | 8.0% | 4.5%(+3.52)#86 | 4.9%(+3.05)#4,904 |
| 87. | 74333 | 8.0% | 4.5%(+3.51)#87 | 4.9%(+3.04)#4,912 |
| 88. | 74956 | 8.0% | 4.5%(+3.50)#88 | 4.9%(+3.02)#4,940 |
| 89. | 73179 | 7.9% | 4.5%(+3.47)#89 | 4.9%(+3.00)#4,972 |
| 90. | 74632 | 7.9% | 4.5%(+3.40)#90 | 4.9%(+2.93)#5,064 |
| 91. | 74337 | 7.9% | 4.5%(+3.40)#91 | 4.9%(+2.93)#5,069 |
| 92. | 74824 | 7.8% | 4.5%(+3.37)#92 | 4.9%(+2.90)#5,110 |
| 93. | 74083 | 7.8% | 4.5%(+3.35)#93 | 4.9%(+2.88)#5,150 |
| 94. | 74130 | 7.8% | 4.5%(+3.34)#94 | 4.9%(+2.86)#5,166 |
| 95. | 73059 | 7.8% | 4.5%(+3.32)#95 | 4.9%(+2.85)#5,190 |
| 96. | 74531 | 7.7% | 4.5%(+3.22)#96 | 4.9%(+2.75)#5,329 |
| 97. | 74850 | 7.7% | 4.5%(+3.22)#97 | 4.9%(+2.75)#5,334 |
| 98. | 73728 | 7.7% | 4.5%(+3.20)#98 | 4.9%(+2.73)#5,367 |
| 99. | 74080 | 7.7% | 4.5%(+3.20)#99 | 4.9%(+2.72)#5,372 |
| 100. | 74054 | 7.6% | 4.5%(+3.17)#100 | 4.9%(+2.69)#5,410 |
Common Questions
What are the Top 10 Zip Codes with the Highest Percentage of Population Employed in Transportation & Warehousing in Oklahoma?
Top 10 Zip Codes with the Highest Percentage of Population Employed in Transportation & Warehousing in Oklahoma are:
What zip code has the Highest Percentage of Population Employed in Transportation & Warehousing in Oklahoma?
73488 has the Highest Percentage of Population Employed in Transportation & Warehousing in Oklahoma with 50.0%.
What is the Percentage of Population Employed in Transportation & Warehousing in the State of Oklahoma?
Percentage of Population Employed in Transportation & Warehousing in Oklahoma is 4.5%.
What is the Percentage of Population Employed in Transportation & Warehousing in the United States?
Percentage of Population Employed in Transportation & Warehousing in the United States is 4.9%.