Zip Codes with the Highest Percentage of Population Employed in Construction & Extraction in Oklahoma
RELATED REPORTS & OPTIONS
Construction & Extraction
Oklahoma
Compare Zip Codes
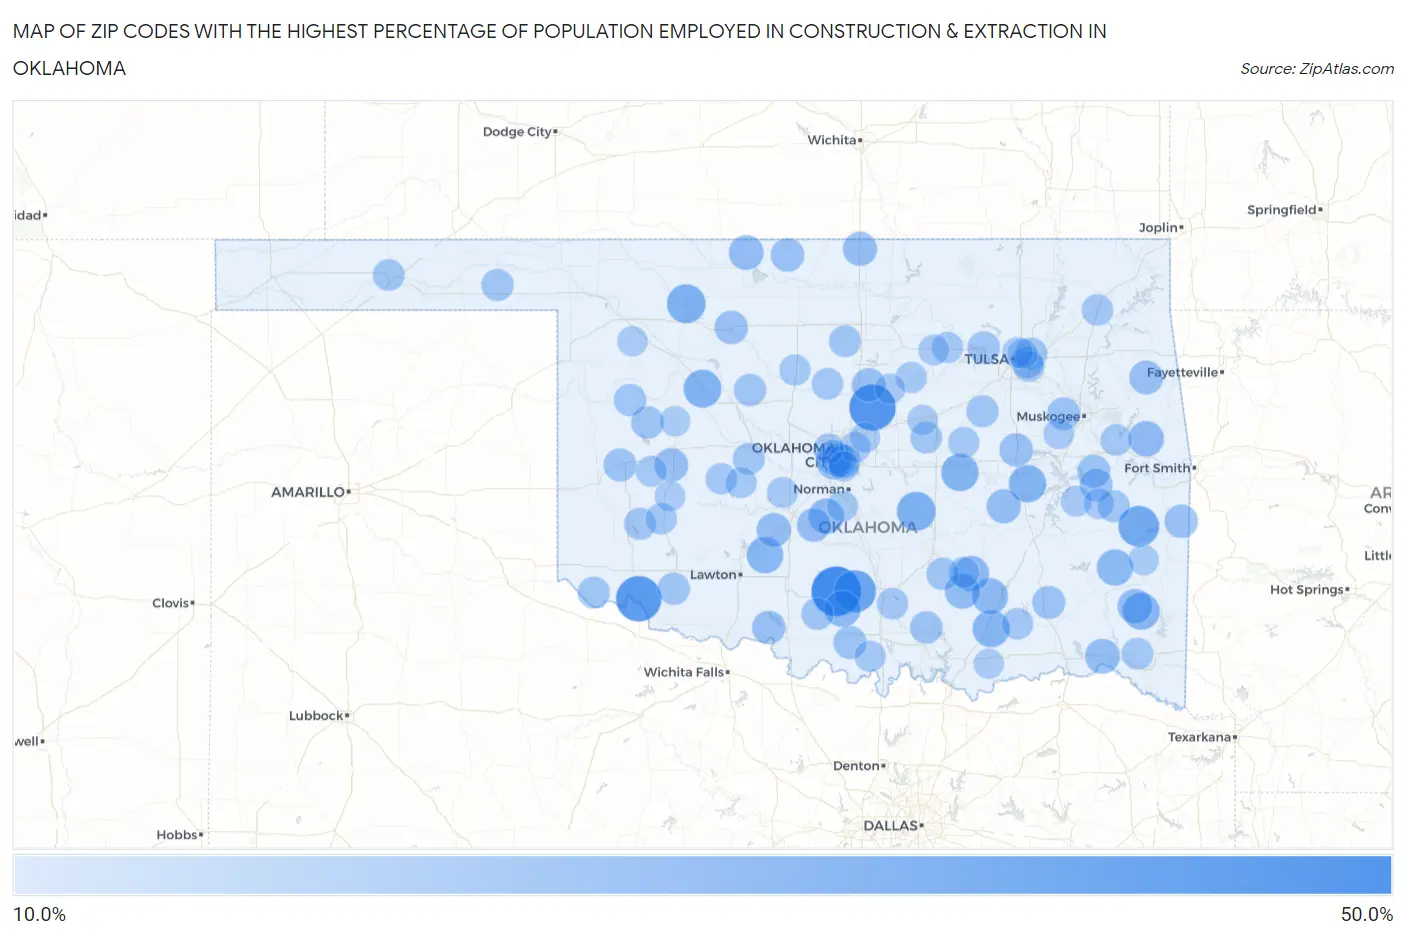
Map of Zip Codes with the Highest Percentage of Population Employed in Construction & Extraction in Oklahoma
10.0%
50.0%
Zip Codes with the Highest Percentage of Population Employed in Construction & Extraction in Oklahoma
| Zip Code | % Employed | vs State | vs National | |
| 1. | 73488 | 50.0% | 6.1%(+43.9)#1 | 5.0%(+45.0)#132 |
| 2. | 73058 | 43.4% | 6.1%(+37.3)#2 | 5.0%(+38.4)#176 |
| 3. | 73539 | 41.8% | 6.1%(+35.7)#3 | 5.0%(+36.8)#194 |
| 4. | 73444 | 35.1% | 6.1%(+29.0)#4 | 5.0%(+30.1)#290 |
| 5. | 74935 | 32.5% | 6.1%(+26.4)#5 | 5.0%(+27.5)#345 |
| 6. | 74866 | 28.6% | 6.1%(+22.5)#6 | 5.0%(+23.6)#437 |
| 7. | 73860 | 28.5% | 6.1%(+22.4)#7 | 5.0%(+23.5)#447 |
| 8. | 73658 | 26.9% | 6.1%(+20.8)#8 | 5.0%(+21.9)#514 |
| 9. | 74845 | 26.1% | 6.1%(+20.0)#9 | 5.0%(+21.1)#548 |
| 10. | 74837 | 25.9% | 6.1%(+19.8)#10 | 5.0%(+20.9)#554 |
| 11. | 74724 | 25.4% | 6.1%(+19.3)#11 | 5.0%(+20.4)#571 |
| 12. | 74533 | 25.4% | 6.1%(+19.3)#12 | 5.0%(+20.4)#572 |
| 13. | 73567 | 24.5% | 6.1%(+18.5)#13 | 5.0%(+19.5)#617 |
| 14. | 73435 | 24.0% | 6.1%(+17.9)#14 | 5.0%(+19.0)#649 |
| 15. | 74521 | 23.8% | 6.1%(+17.7)#15 | 5.0%(+18.8)#663 |
| 16. | 74556 | 23.3% | 6.1%(+17.2)#16 | 5.0%(+18.3)#698 |
| 17. | 74534 | 22.9% | 6.1%(+16.8)#17 | 5.0%(+17.9)#730 |
| 18. | 74945 | 22.2% | 6.1%(+16.1)#18 | 5.0%(+17.2)#775 |
| 19. | 73031 | 22.2% | 6.1%(+16.1)#19 | 5.0%(+17.2)#778 |
| 20. | 74535 | 21.7% | 6.1%(+15.7)#20 | 5.0%(+16.7)#820 |
| 21. | 74761 | 21.1% | 6.1%(+15.0)#21 | 5.0%(+16.1)#885 |
| 22. | 73722 | 21.0% | 6.1%(+14.9)#22 | 5.0%(+16.0)#892 |
| 23. | 74722 | 20.9% | 6.1%(+14.8)#23 | 5.0%(+15.9)#904 |
| 24. | 73108 | 20.4% | 6.1%(+14.3)#24 | 5.0%(+15.4)#950 |
| 25. | 73017 | 19.8% | 6.1%(+13.7)#25 | 5.0%(+14.8)#1,019 |
| 26. | 74850 | 19.8% | 6.1%(+13.7)#26 | 5.0%(+14.8)#1,024 |
| 27. | 74632 | 19.7% | 6.1%(+13.6)#27 | 5.0%(+14.7)#1,036 |
| 28. | 73119 | 19.5% | 6.1%(+13.4)#28 | 5.0%(+14.5)#1,061 |
| 29. | 74457 | 19.1% | 6.1%(+13.0)#29 | 5.0%(+14.1)#1,118 |
| 30. | 73109 | 19.0% | 6.1%(+12.9)#30 | 5.0%(+14.0)#1,130 |
| 31. | 73622 | 18.9% | 6.1%(+12.8)#31 | 5.0%(+13.9)#1,143 |
| 32. | 73027 | 18.9% | 6.1%(+12.8)#32 | 5.0%(+13.9)#1,148 |
| 33. | 73002 | 18.8% | 6.1%(+12.8)#33 | 5.0%(+13.8)#1,161 |
| 34. | 73129 | 18.6% | 6.1%(+12.5)#34 | 5.0%(+13.6)#1,201 |
| 35. | 74460 | 18.5% | 6.1%(+12.4)#35 | 5.0%(+13.5)#1,207 |
| 36. | 73548 | 18.5% | 6.1%(+12.4)#36 | 5.0%(+13.5)#1,208 |
| 37. | 73729 | 18.3% | 6.1%(+12.2)#37 | 5.0%(+13.3)#1,251 |
| 38. | 73771 | 18.3% | 6.1%(+12.2)#38 | 5.0%(+13.3)#1,252 |
| 39. | 74947 | 18.2% | 6.1%(+12.1)#39 | 5.0%(+13.2)#1,265 |
| 40. | 74557 | 17.7% | 6.1%(+11.6)#40 | 5.0%(+12.7)#1,347 |
| 41. | 74463 | 17.6% | 6.1%(+11.6)#41 | 5.0%(+12.7)#1,351 |
| 42. | 73644 | 17.6% | 6.1%(+11.5)#42 | 5.0%(+12.6)#1,366 |
| 43. | 73463 | 17.6% | 6.1%(+11.5)#43 | 5.0%(+12.6)#1,368 |
| 44. | 74455 | 17.5% | 6.1%(+11.5)#44 | 5.0%(+12.5)#1,376 |
| 45. | 74472 | 17.5% | 6.1%(+11.4)#45 | 5.0%(+12.5)#1,389 |
| 46. | 73625 | 17.0% | 6.1%(+10.9)#46 | 5.0%(+12.0)#1,468 |
| 47. | 73455 | 16.7% | 6.1%(+10.7)#47 | 5.0%(+11.7)#1,520 |
| 48. | 74842 | 16.3% | 6.1%(+10.3)#48 | 5.0%(+11.4)#1,628 |
| 49. | 74060 | 16.3% | 6.1%(+10.3)#49 | 5.0%(+11.3)#1,629 |
| 50. | 73555 | 16.2% | 6.1%(+10.1)#50 | 5.0%(+11.2)#1,660 |
| 51. | 73744 | 16.2% | 6.1%(+10.1)#51 | 5.0%(+11.2)#1,661 |
| 52. | 73654 | 16.1% | 6.1%(+10.1)#52 | 5.0%(+11.1)#1,682 |
| 53. | 73442 | 16.1% | 6.1%(+10.0)#53 | 5.0%(+11.1)#1,684 |
| 54. | 74116 | 16.0% | 6.1%(+9.95)#54 | 5.0%(+11.0)#1,708 |
| 55. | 74071 | 16.0% | 6.1%(+9.92)#55 | 5.0%(+11.0)#1,716 |
| 56. | 73932 | 16.0% | 6.1%(+9.87)#56 | 5.0%(+11.0)#1,728 |
| 57. | 74943 | 15.6% | 6.1%(+9.48)#57 | 5.0%(+10.6)#1,838 |
| 58. | 73655 | 15.5% | 6.1%(+9.42)#58 | 5.0%(+10.5)#1,851 |
| 59. | 73537 | 15.4% | 6.1%(+9.36)#59 | 5.0%(+10.4)#1,865 |
| 60. | 74869 | 15.3% | 6.1%(+9.25)#60 | 5.0%(+10.3)#1,895 |
| 61. | 73757 | 15.2% | 6.1%(+9.16)#61 | 5.0%(+10.2)#1,936 |
| 62. | 73047 | 15.2% | 6.1%(+9.15)#62 | 5.0%(+10.2)#1,937 |
| 63. | 73942 | 15.1% | 6.1%(+8.99)#63 | 5.0%(+10.1)#1,995 |
| 64. | 74737 | 15.0% | 6.1%(+8.92)#64 | 5.0%(+10.0)#2,029 |
| 65. | 74332 | 14.8% | 6.1%(+8.72)#65 | 5.0%(+9.81)#2,103 |
| 66. | 74555 | 14.8% | 6.1%(+8.67)#66 | 5.0%(+9.76)#2,133 |
| 67. | 73028 | 14.6% | 6.1%(+8.54)#67 | 5.0%(+9.62)#2,190 |
| 68. | 74435 | 14.5% | 6.1%(+8.43)#68 | 5.0%(+9.52)#2,237 |
| 69. | 73032 | 14.5% | 6.1%(+8.41)#69 | 5.0%(+9.50)#2,243 |
| 70. | 73651 | 14.5% | 6.1%(+8.41)#70 | 5.0%(+9.50)#2,245 |
| 71. | 74129 | 14.4% | 6.1%(+8.35)#71 | 5.0%(+9.44)#2,266 |
| 72. | 73033 | 14.4% | 6.1%(+8.32)#72 | 5.0%(+9.40)#2,279 |
| 73. | 74034 | 14.3% | 6.1%(+8.21)#73 | 5.0%(+9.29)#2,330 |
| 74. | 74146 | 14.2% | 6.1%(+8.11)#74 | 5.0%(+9.19)#2,369 |
| 75. | 74062 | 14.1% | 6.1%(+8.04)#75 | 5.0%(+9.13)#2,398 |
| 76. | 73742 | 14.1% | 6.1%(+7.98)#76 | 5.0%(+9.06)#2,432 |
| 77. | 73624 | 13.9% | 6.1%(+7.83)#77 | 5.0%(+8.91)#2,502 |
| 78. | 73093 | 13.8% | 6.1%(+7.75)#78 | 5.0%(+8.84)#2,535 |
| 79. | 73079 | 13.8% | 6.1%(+7.74)#79 | 5.0%(+8.83)#2,537 |
| 80. | 73453 | 13.8% | 6.1%(+7.73)#80 | 5.0%(+8.82)#2,546 |
| 81. | 73009 | 13.8% | 6.1%(+7.69)#81 | 5.0%(+8.78)#2,558 |
| 82. | 74833 | 13.7% | 6.1%(+7.64)#82 | 5.0%(+8.72)#2,589 |
| 83. | 74572 | 13.7% | 6.1%(+7.61)#83 | 5.0%(+8.70)#2,612 |
| 84. | 74561 | 13.5% | 6.1%(+7.46)#84 | 5.0%(+8.55)#2,684 |
| 85. | 74045 | 13.3% | 6.1%(+7.25)#85 | 5.0%(+8.34)#2,783 |
| 86. | 74552 | 13.3% | 6.1%(+7.22)#86 | 5.0%(+8.31)#2,794 |
| 87. | 74110 | 13.3% | 6.1%(+7.22)#87 | 5.0%(+8.31)#2,795 |
| 88. | 73141 | 13.3% | 6.1%(+7.21)#88 | 5.0%(+8.30)#2,801 |
| 89. | 74468 | 13.1% | 6.1%(+7.00)#89 | 5.0%(+8.09)#2,891 |
| 90. | 73122 | 13.0% | 6.1%(+6.89)#90 | 5.0%(+7.98)#2,952 |
| 91. | 73149 | 12.8% | 6.1%(+6.68)#91 | 5.0%(+7.76)#3,077 |
| 92. | 73661 | 12.8% | 6.1%(+6.67)#92 | 5.0%(+7.76)#3,078 |
| 93. | 74577 | 12.7% | 6.1%(+6.65)#93 | 5.0%(+7.73)#3,093 |
| 94. | 73639 | 12.7% | 6.1%(+6.59)#94 | 5.0%(+7.67)#3,142 |
| 95. | 74115 | 12.6% | 6.1%(+6.50)#95 | 5.0%(+7.59)#3,200 |
| 96. | 74026 | 12.6% | 6.1%(+6.49)#96 | 5.0%(+7.58)#3,206 |
| 97. | 73857 | 12.5% | 6.1%(+6.45)#97 | 5.0%(+7.54)#3,228 |
| 98. | 73049 | 12.5% | 6.1%(+6.44)#98 | 5.0%(+7.53)#3,232 |
| 99. | 74059 | 12.5% | 6.1%(+6.40)#99 | 5.0%(+7.49)#3,280 |
| 100. | 74726 | 12.4% | 6.1%(+6.34)#100 | 5.0%(+7.43)#3,331 |
Common Questions
What are the Top 10 Zip Codes with the Highest Percentage of Population Employed in Construction & Extraction in Oklahoma?
Top 10 Zip Codes with the Highest Percentage of Population Employed in Construction & Extraction in Oklahoma are:
What zip code has the Highest Percentage of Population Employed in Construction & Extraction in Oklahoma?
73488 has the Highest Percentage of Population Employed in Construction & Extraction in Oklahoma with 50.0%.
What is the Percentage of Population Employed in Construction & Extraction in the State of Oklahoma?
Percentage of Population Employed in Construction & Extraction in Oklahoma is 6.1%.
What is the Percentage of Population Employed in Construction & Extraction in the United States?
Percentage of Population Employed in Construction & Extraction in the United States is 5.0%.