Zip Codes with the Highest Percentage of Households Heated by Bottled Gas / Liquid Propane in Stillwater, OK
RELATED REPORTS & OPTIONS
Bottled Gas / LP Heating
Stillwater
Compare Zip Codes
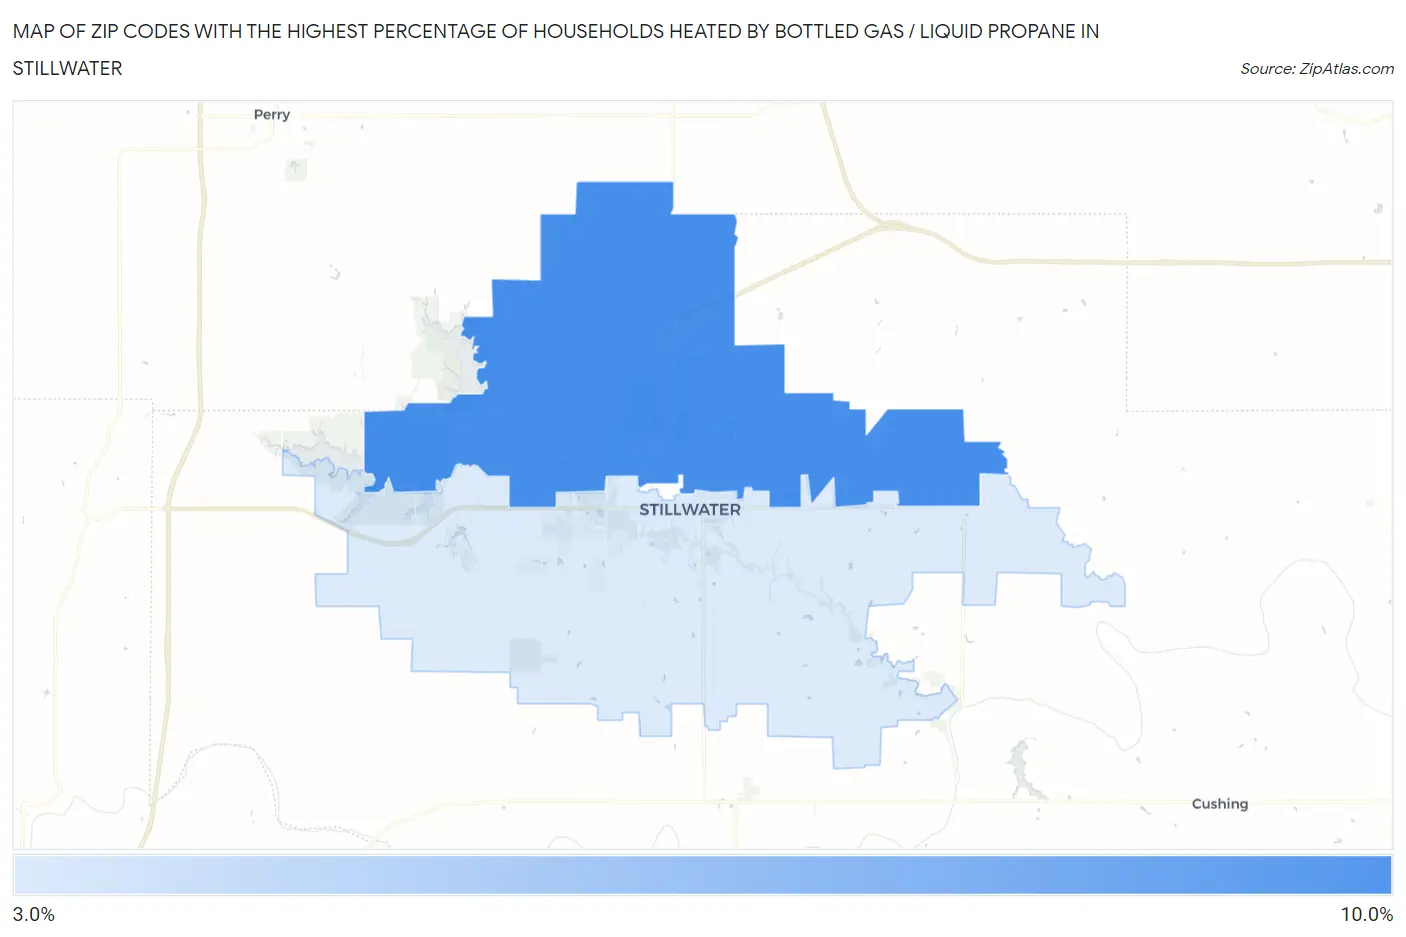
Map of Zip Codes with the Highest Percentage of Households Heated by Bottled Gas / Liquid Propane in Stillwater
0.0%
10.0%
Zip Codes with the Highest Percentage of Households Heated by Bottled Gas / Liquid Propane in Stillwater, OK
| Zip Code | Bottled Gas / LP Heating | vs State | vs National | |
| 1. | 74075 | 8.1% | 6.3%(+1.80)#408 | 4.9%(+3.20)#15,843 |
| 2. | 74074 | 3.9% | 6.3%(-2.40)#499 | 4.9%(-1.00)#19,724 |
1
Common Questions
What are the Top Zip Codes with the Highest Percentage of Households Heated by Bottled Gas / Liquid Propane in Stillwater, OK?
Top Zip Codes with the Highest Percentage of Households Heated by Bottled Gas / Liquid Propane in Stillwater, OK are:
What zip code has the Highest Percentage of Households Heated by Bottled Gas / Liquid Propane in Stillwater, OK?
74075 has the Highest Percentage of Households Heated by Bottled Gas / Liquid Propane in Stillwater, OK with 8.1%.
What is the Percentage of Households Heated by Bottled Gas / Liquid Propane in Stillwater, OK?
Percentage of Households Heated by Bottled Gas / Liquid Propane in Stillwater is 4.3%.
What is the Percentage of Households Heated by Bottled Gas / Liquid Propane in Oklahoma?
Percentage of Households Heated by Bottled Gas / Liquid Propane in Oklahoma is 6.3%.
What is the Percentage of Households Heated by Bottled Gas / Liquid Propane in the United States?
Percentage of Households Heated by Bottled Gas / Liquid Propane in the United States is 4.9%.