Zip Codes with the Highest Percentage of Owner-Occupied Units in Ponca City, OK
RELATED REPORTS & OPTIONS
Highest Owner-Occupied
Ponca City
Compare Zip Codes
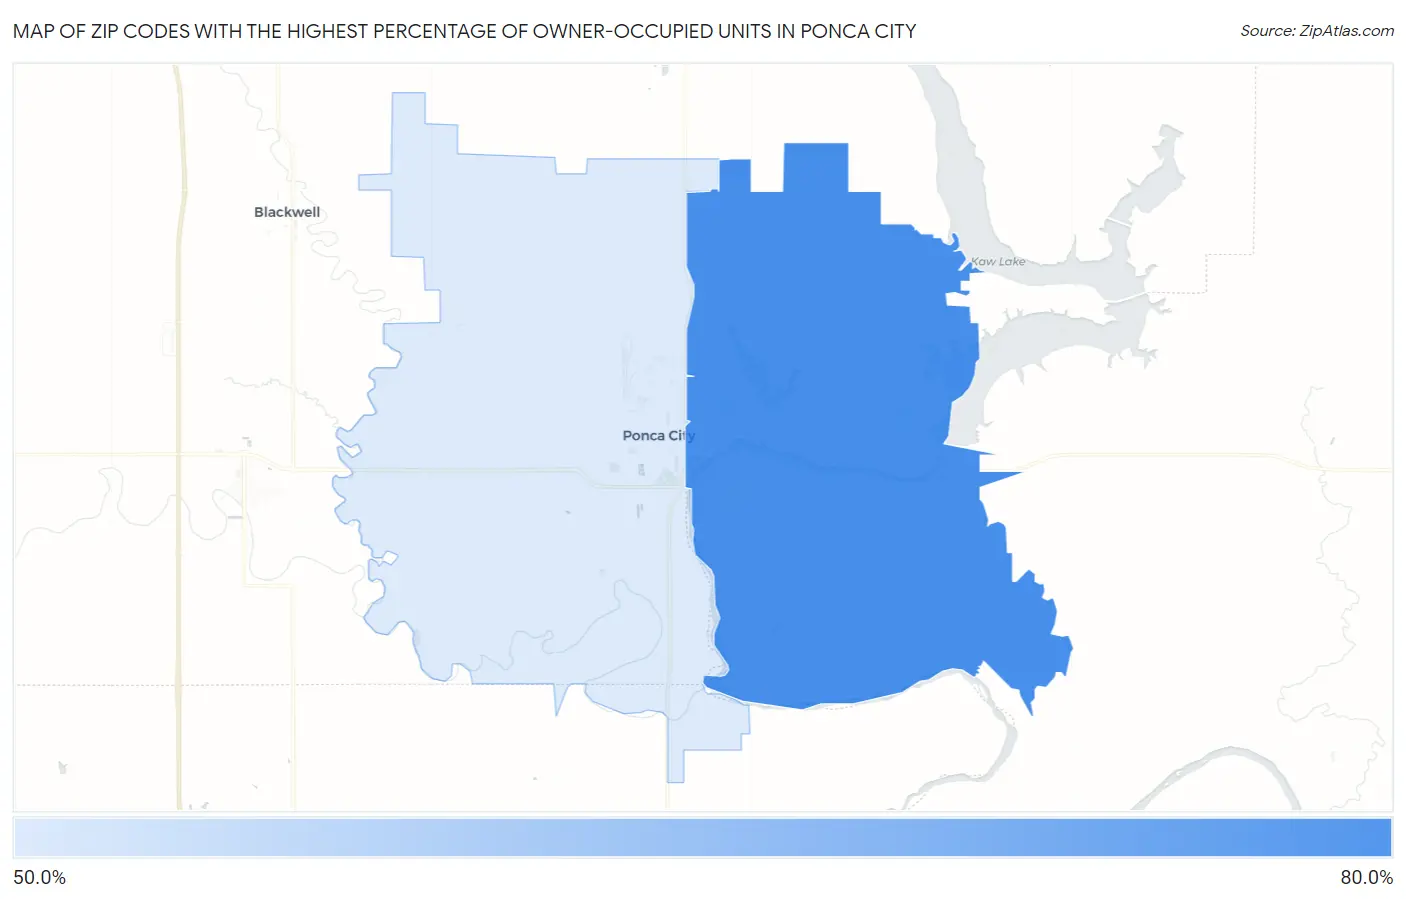
Map of Zip Codes with the Highest Percentage of Owner-Occupied Units in Ponca City
0.0%
80.0%
Zip Codes with the Highest Percentage of Owner-Occupied Units in Ponca City, OK
| Zip Code | % Owner-Occupied | vs State | vs National | |
| 1. | 74604 | 78.4% | 65.9%(+12.4)#294 | 64.8%(+13.5)#16,145 |
| 2. | 74601 | 58.5% | 65.9%(-7.40)#574 | 64.8%(-6.27)#27,846 |
1
Common Questions
What are the Top Zip Codes with the Highest Percentage of Owner-Occupied Units in Ponca City, OK?
Top Zip Codes with the Highest Percentage of Owner-Occupied Units in Ponca City, OK are:
What zip code has the Highest Percentage of Owner-Occupied Units in Ponca City, OK?
74604 has the Highest Percentage of Owner-Occupied Units in Ponca City, OK with 78.4%.
What is the Percentage of Owner-Occupied Units in Ponca City, OK?
Percentage of Owner-Occupied Units in Ponca City is 61.6%.
What is the Percentage of Owner-Occupied Units in Oklahoma?
Percentage of Owner-Occupied Units in Oklahoma is 65.9%.
What is the Percentage of Owner-Occupied Units in the United States?
Percentage of Owner-Occupied Units in the United States is 64.8%.