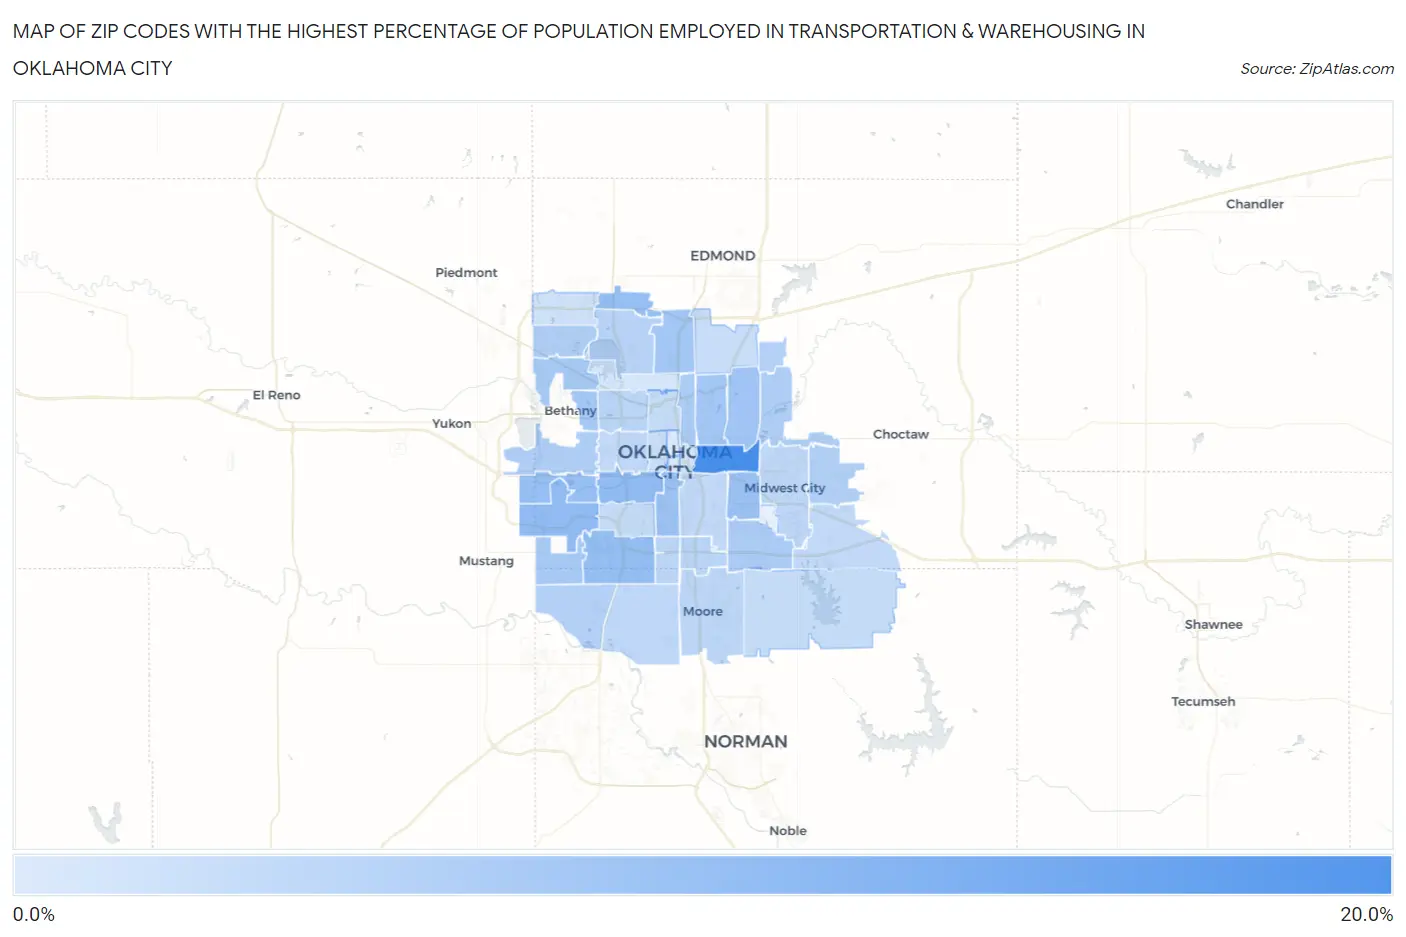
Zip Codes with the Highest Percentage of Population Employed in Transportation & Warehousing in Oklahoma City, OK
RELATED REPORTS & OPTIONS
Transportation & Warehousing
Oklahoma City
Compare Zip Codes
Map of Zip Codes with the Highest Percentage of Population Employed in Transportation & Warehousing in Oklahoma City
0.0%
20.0%
Zip Codes with the Highest Percentage of Population Employed in Transportation & Warehousing in Oklahoma City, OK
| Zip Code | % Employed | vs State | vs National | |
| 1. | 73117 | 15.1% | 4.5%(+10.6)#19 | 4.9%(+10.2)#1,035 |
| 2. | 73108 | 8.0% | 4.5%(+3.52)#86 | 4.9%(+3.05)#4,904 |
| 3. | 73179 | 7.9% | 4.5%(+3.47)#89 | 4.9%(+3.00)#4,972 |
| 4. | 73134 | 7.6% | 4.5%(+3.09)#104 | 4.9%(+2.61)#5,553 |
| 5. | 73159 | 7.5% | 4.5%(+3.00)#111 | 4.9%(+2.53)#5,689 |
| 6. | 73128 | 7.2% | 4.5%(+2.76)#121 | 4.9%(+2.29)#6,124 |
| 7. | 73115 | 7.1% | 4.5%(+2.65)#126 | 4.9%(+2.17)#6,320 |
| 8. | 73109 | 7.1% | 4.5%(+2.60)#128 | 4.9%(+2.13)#6,395 |
| 9. | 73121 | 6.5% | 4.5%(+2.01)#155 | 4.9%(+1.54)#7,605 |
| 10. | 73114 | 6.3% | 4.5%(+1.82)#167 | 4.9%(+1.35)#8,058 |
| 11. | 73111 | 6.1% | 4.5%(+1.66)#175 | 4.9%(+1.18)#8,458 |
| 12. | 73122 | 6.0% | 4.5%(+1.51)#190 | 4.9%(+1.04)#8,813 |
| 13. | 73169 | 5.8% | 4.5%(+1.36)#195 | 4.9%(+0.888)#9,242 |
| 14. | 73132 | 5.8% | 4.5%(+1.30)#201 | 4.9%(+0.832)#9,407 |
| 15. | 73105 | 5.4% | 4.5%(+0.955)#228 | 4.9%(+0.484)#10,460 |
| 16. | 73135 | 5.4% | 4.5%(+0.939)#229 | 4.9%(+0.468)#10,524 |
| 17. | 73141 | 5.2% | 4.5%(+0.709)#254 | 4.9%(+0.237)#11,301 |
| 18. | 73127 | 5.0% | 4.5%(+0.569)#262 | 4.9%(+0.097)#11,804 |
| 19. | 73162 | 4.9% | 4.5%(+0.382)#279 | 4.9%(-0.089)#12,421 |
| 20. | 73151 | 4.8% | 4.5%(+0.313)#281 | 4.9%(-0.158)#12,695 |
| 21. | 73173 | 4.7% | 4.5%(+0.198)#296 | 4.9%(-0.273)#13,128 |
| 22. | 73130 | 4.6% | 4.5%(+0.173)#299 | 4.9%(-0.298)#13,223 |
| 23. | 73120 | 4.3% | 4.5%(-0.157)#330 | 4.9%(-0.628)#14,517 |
| 24. | 73112 | 4.1% | 4.5%(-0.347)#350 | 4.9%(-0.818)#15,347 |
| 25. | 73149 | 4.1% | 4.5%(-0.372)#352 | 4.9%(-0.843)#15,451 |
| 26. | 73139 | 3.9% | 4.5%(-0.597)#369 | 4.9%(-1.07)#16,466 |
| 27. | 73160 | 3.8% | 4.5%(-0.652)#373 | 4.9%(-1.12)#16,693 |
| 28. | 73170 | 3.8% | 4.5%(-0.712)#377 | 4.9%(-1.18)#16,957 |
| 29. | 73110 | 3.7% | 4.5%(-0.754)#381 | 4.9%(-1.23)#17,133 |
| 30. | 73129 | 3.4% | 4.5%(-1.09)#415 | 4.9%(-1.56)#18,540 |
| 31. | 73107 | 3.4% | 4.5%(-1.10)#417 | 4.9%(-1.57)#18,604 |
| 32. | 73150 | 3.4% | 4.5%(-1.10)#418 | 4.9%(-1.57)#18,606 |
| 33. | 73165 | 3.1% | 4.5%(-1.39)#446 | 4.9%(-1.86)#19,873 |
| 34. | 73119 | 3.0% | 4.5%(-1.44)#452 | 4.9%(-1.92)#20,130 |
| 35. | 73118 | 3.0% | 4.5%(-1.52)#462 | 4.9%(-1.99)#20,450 |
| 36. | 73131 | 2.9% | 4.5%(-1.61)#471 | 4.9%(-2.08)#20,823 |
| 37. | 73106 | 2.7% | 4.5%(-1.78)#488 | 4.9%(-2.26)#21,571 |
| 38. | 73142 | 2.3% | 4.5%(-2.19)#513 | 4.9%(-2.66)#23,237 |
| 39. | 73104 | 1.9% | 4.5%(-2.53)#529 | 4.9%(-3.00)#24,431 |
| 40. | 73116 | 1.6% | 4.5%(-2.85)#543 | 4.9%(-3.32)#25,493 |
| 41. | 73102 | 1.3% | 4.5%(-3.14)#563 | 4.9%(-3.61)#26,287 |
| 42. | 73103 | 1.00% | 4.5%(-3.48)#580 | 4.9%(-3.95)#27,005 |
1
Common Questions
What are the Top 10 Zip Codes with the Highest Percentage of Population Employed in Transportation & Warehousing in Oklahoma City, OK?
Top 10 Zip Codes with the Highest Percentage of Population Employed in Transportation & Warehousing in Oklahoma City, OK are:
What zip code has the Highest Percentage of Population Employed in Transportation & Warehousing in Oklahoma City, OK?
73117 has the Highest Percentage of Population Employed in Transportation & Warehousing in Oklahoma City, OK with 15.1%.
What is the Percentage of Population Employed in Transportation & Warehousing in Oklahoma City, OK?
Percentage of Population Employed in Transportation & Warehousing in Oklahoma City is 4.4%.
What is the Percentage of Population Employed in Transportation & Warehousing in Oklahoma?
Percentage of Population Employed in Transportation & Warehousing in Oklahoma is 4.5%.
What is the Percentage of Population Employed in Transportation & Warehousing in the United States?
Percentage of Population Employed in Transportation & Warehousing in the United States is 4.9%.