Zip Codes with the Highest Percentage of Population Employed in Arts, Entertainment & Recreation in Oklahoma City, OK

RELATED REPORTS & OPTIONS

Arts, Entertainment & Recreation
Population
Families and Households
Female Fertility
Female Fertility (Unmarried)
Race (Community Size)
Race (Percentage)
Ancestry (Community Size)
AfricanAlaska NativeAlbanianAmericanApacheArabArapahoArgentineanArmenianAustralianAustrianBahamianBangladeshiBarbadianBasqueBelgianBhutaneseBlackfeetBolivianBrazilianBritishBritish West IndianBulgarianBurmeseCajunCambodianCanadianCelticCentral AmericanCentral American IndianCherokeeCheyenneChickasawChileanChippewaChoctawColombianComancheCreeCreekCroatianCubanCzechCzechoslovakianDanishDelawareDominicanDutchDutch West IndianEastern EuropeanEcuadorianEgyptianEnglishEstonianEthiopianEuropeanFijianFilipinoFinnishFrenchFrench American IndianFrench CanadianGermanGerman RussianGhanaianGreekGuamanian / ChamorroGuatemalanGuyaneseHaitianHonduranHopiHungarianIcelanderIndian (Asian)IndonesianInupiatIranianIraqiIrishIroquoisIsraeliItalianJamaicanJapaneseJordanianKenyanKiowaKoreanLaotianLatvianLebaneseLiberianLithuanianLuxembourgerMalaysianMexicanMexican American IndianMongolianMoroccanNative HawaiianNavajoNew ZealanderNicaraguanNigerianNorthern EuropeanNorwegianOkinawanOsagePakistaniPalestinianPanamanianPennsylvania GermanPeruvianPimaPolishPortuguesePotawatomiPuebloPuerto RicanRomanianRussianSalvadoranSamoanScandinavianScotch-IrishScottishSeminoleSerbianSiouxSlavicSlovakSloveneSouth AfricanSouth AmericanSouth American IndianSpaniardSpanishSpanish American IndianSri LankanSubsaharan AfricanSudaneseSwedishSwissSyrianThaiTlingit-HaidaTonganTrinidadian and TobagonianTurkishU.S. Virgin IslanderUkrainianUruguayanVenezuelanVietnameseWelshWest IndianYugoslavianZimbabwean
Ancestry (Percentage)
AfricanAlaska NativeAlbanianAmericanApacheArabArapahoArgentineanArmenianAustralianAustrianBahamianBangladeshiBarbadianBasqueBelgianBhutaneseBlackfeetBolivianBrazilianBritishBritish West IndianBulgarianBurmeseCajunCambodianCanadianCelticCentral AmericanCentral American IndianCherokeeCheyenneChickasawChileanChippewaChoctawColombianComancheCreeCreekCroatianCubanCzechCzechoslovakianDanishDelawareDominicanDutchDutch West IndianEastern EuropeanEcuadorianEgyptianEnglishEstonianEthiopianEuropeanFijianFilipinoFinnishFrenchFrench American IndianFrench CanadianGermanGerman RussianGhanaianGreekGuamanian / ChamorroGuatemalanGuyaneseHaitianHonduranHopiHungarianIcelanderIndian (Asian)IndonesianInupiatIranianIraqiIrishIroquoisIsraeliItalianJamaicanJapaneseJordanianKenyanKiowaKoreanLaotianLatvianLebaneseLiberianLithuanianLuxembourgerMalaysianMexicanMexican American IndianMongolianMoroccanNative HawaiianNavajoNew ZealanderNicaraguanNigerianNorthern EuropeanNorwegianOkinawanOsagePakistaniPalestinianPanamanianPennsylvania GermanPeruvianPimaPolishPortuguesePotawatomiPuebloPuerto RicanRomanianRussianSalvadoranSamoanScandinavianScotch-IrishScottishSeminoleSerbianSiouxSlavicSlovakSloveneSouth AfricanSouth AmericanSouth American IndianSpaniardSpanishSpanish American IndianSri LankanSubsaharan AfricanSudaneseSwedishSwissSyrianThaiTlingit-HaidaTonganTrinidadian and TobagonianTurkishU.S. Virgin IslanderUkrainianUruguayanVenezuelanVietnameseWelshWest IndianYugoslavianZimbabwean
Immigrant Origin (Total)
AfricaArgentinaAsiaAustraliaAustriaBahamasBangladeshBosnia and HerzegovinaBrazilBulgariaBurma / MyanmarCambodiaCameroonCanadaCaribbeanCentral AmericaChileChinaColombiaCubaDominican RepublicEastern AfricaEastern AsiaEastern EuropeEcuadorEgyptEl SalvadorEnglandEritreaEthiopiaEuropeFranceGermanyGhanaGreeceGuatemalaHondurasHong KongIndiaIndonesiaIranIraqIrelandItalyJamaicaJapanJordanKazakhstanKenyaKoreaKuwaitLaosLatin AmericaLebanonLiberiaMalaysiaMexicoMiddle AfricaMoroccoNepalNetherlandsNicaraguaNigeriaNorthern AfricaNorthern EuropeNorwayOceaniaPakistanPanamaPeruPhilippinesPolandPortugalRussiaSaudi ArabiaScotlandSingaporeSouth AfricaSouth AmericaSouth Central AsiaSouth Eastern AsiaSouthern EuropeSpainSudanSyriaTaiwanThailandTrinidad and TobagoTurkeyUkraineVenezuelaVietnamWestern AfricaWestern AsiaWestern EuropeZaireZimbabwe
Immigrant Origin (Percentage)
AfricaArgentinaAsiaAustraliaAustriaBahamasBangladeshBosnia and HerzegovinaBrazilBulgariaBurma / MyanmarCambodiaCameroonCanadaCaribbeanCentral AmericaChileChinaColombiaCubaDominican RepublicEastern AfricaEastern AsiaEastern EuropeEcuadorEgyptEl SalvadorEnglandEritreaEthiopiaEuropeFranceGermanyGhanaGreeceGuatemalaHondurasHong KongIndiaIndonesiaIranIraqIrelandItalyJamaicaJapanJordanKazakhstanKenyaKoreaKuwaitLaosLatin AmericaLebanonLiberiaMalaysiaMexicoMiddle AfricaMoroccoNepalNetherlandsNicaraguaNigeriaNorthern AfricaNorthern EuropeNorwayOceaniaPakistanPanamaPeruPhilippinesPolandPortugalRussiaSaudi ArabiaScotlandSingaporeSouth AfricaSouth AmericaSouth Central AsiaSouth Eastern AsiaSouthern EuropeSpainSudanSyriaTaiwanThailandTrinidad and TobagoTurkeyUkraineVenezuelaVietnamWestern AfricaWestern AsiaWestern EuropeZaireZimbabwe
Income
Income (Families)
Income (Households)
Poverty
Poverty (Families)
Unemployment
Employment Occupations
Employment Industries
Employer Class
Commute Time
Commute Means
School Enrollment
Education by Degree Field
Occupancy
Finances
Physical Characteristics
Oklahoma City
Compare Zip Codes
Comparison Subject

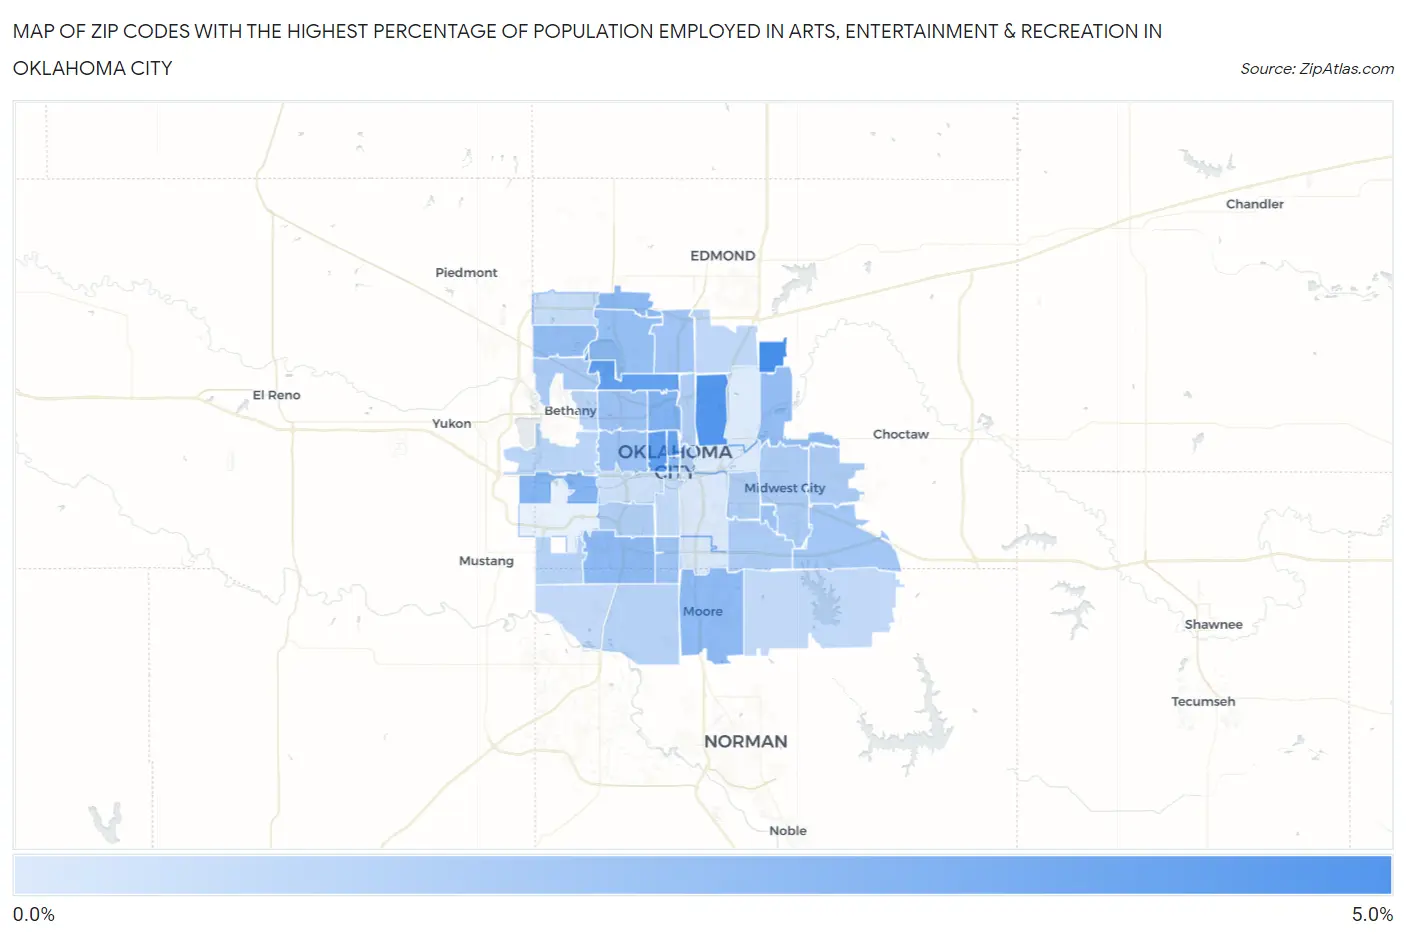
Map of Zip Codes with the Highest Percentage of Population Employed in Arts, Entertainment & Recreation in Oklahoma City

0.0%
5.0%
Zip Codes with the Highest Percentage of Population Employed in Arts, Entertainment & Recreation in Oklahoma City Map

Zip Codes with the Highest Percentage of Population Employed in Arts, Entertainment & Recreation in Oklahoma City, OK

Zip Code % Employed vs State vs National
1.731514.2%2.4%(+1.85)#1052.1%(+2.16)#3,025
2.731113.9%2.4%(+1.54)#1172.1%(+1.85)#3,432
3.731063.6%2.4%(+1.19)#1352.1%(+1.50)#3,986
4.731033.5%2.4%(+1.11)#1422.1%(+1.42)#4,119
5.731163.5%2.4%(+1.11)#1452.1%(+1.42)#4,135
6.731182.7%2.4%(+0.345)#1912.1%(+0.653)#6,236
7.731282.6%2.4%(+0.241)#1962.1%(+0.549)#6,635
8.731022.5%2.4%(+0.110)#2132.1%(+0.417)#7,173
9.731342.4%2.4%(+0.054)#2232.1%(+0.361)#7,446
10.731602.4%2.4%(+0.023)#2282.1%(+0.331)#7,583
11.731592.4%2.4%(+0.001)#2322.1%(+0.309)#7,677
12.731412.3%2.4%(-0.128)#2442.1%(+0.179)#8,320
13.731622.3%2.4%(-0.138)#2462.1%(+0.170)#8,375
14.731202.2%2.4%(-0.158)#2522.1%(+0.150)#8,455
15.731452.1%2.4%(-0.303)#2702.1%(+0.004)#9,290
16.731072.0%2.4%(-0.377)#2782.1%(-0.069)#9,691
17.731122.0%2.4%(-0.382)#2792.1%(-0.074)#9,726
18.731392.0%2.4%(-0.406)#2812.1%(-0.098)#9,867
19.731141.9%2.4%(-0.463)#2952.1%(-0.155)#10,211
20.731501.9%2.4%(-0.511)#2992.1%(-0.203)#10,493
21.731321.7%2.4%(-0.711)#3282.1%(-0.403)#11,877
22.731301.6%2.4%(-0.751)#3362.1%(-0.443)#12,163
23.731351.6%2.4%(-0.765)#3372.1%(-0.457)#12,248
24.731101.6%2.4%(-0.766)#3382.1%(-0.458)#12,258
25.731191.6%2.4%(-0.814)#3492.1%(-0.506)#12,632
26.731151.6%2.4%(-0.814)#3502.1%(-0.506)#12,639
27.731051.6%2.4%(-0.817)#3512.1%(-0.509)#12,669
28.731041.5%2.4%(-0.869)#3572.1%(-0.561)#13,099
29.731691.4%2.4%(-1.01)#3782.1%(-0.702)#14,132
30.731701.4%2.4%(-1.01)#3792.1%(-0.705)#14,147
31.731221.4%2.4%(-1.04)#3832.1%(-0.732)#14,362
32.731271.3%2.4%(-1.12)#3932.1%(-0.815)#14,962
33.731311.2%2.4%(-1.22)#4032.1%(-0.914)#15,711
34.731731.1%2.4%(-1.28)#4112.1%(-0.970)#16,136
35.731651.1%2.4%(-1.28)#4132.1%(-0.971)#16,146
36.731091.1%2.4%(-1.32)#4172.1%(-1.02)#16,490
37.731420.96%2.4%(-1.43)#4302.1%(-1.12)#17,277
38.731080.81%2.4%(-1.58)#4422.1%(-1.27)#18,333
39.731490.54%2.4%(-1.86)#4652.1%(-1.55)#20,269
40.731290.45%2.4%(-1.94)#4732.1%(-1.63)#20,809
41.731170.40%2.4%(-1.99)#4782.1%(-1.68)#21,120
42.731210.40%2.4%(-1.99)#4792.1%(-1.69)#21,125

Common Questions

What are the Top 10 Zip Codes with the Highest Percentage of Population Employed in Arts, Entertainment & Recreation in Oklahoma City, OK?
Top 10 Zip Codes with the Highest Percentage of Population Employed in Arts, Entertainment & Recreation in Oklahoma City, OK are:
#1
4.2%
#2
3.9%
#3
3.6%
#4
3.5%
#5
3.5%
#6
2.7%
#7
2.6%
#8
2.5%
#9
2.4%
#10
2.4%
What zip code has the Highest Percentage of Population Employed in Arts, Entertainment & Recreation in Oklahoma City, OK?
73151 has the Highest Percentage of Population Employed in Arts, Entertainment & Recreation in Oklahoma City, OK with 4.2%.
What is the Percentage of Population Employed in Arts, Entertainment & Recreation in Oklahoma City, OK?
Percentage of Population Employed in Arts, Entertainment & Recreation in Oklahoma City is 1.8%.
What is the Percentage of Population Employed in Arts, Entertainment & Recreation in Oklahoma?
Percentage of Population Employed in Arts, Entertainment & Recreation in Oklahoma is 2.4%.
What is the Percentage of Population Employed in Arts, Entertainment & Recreation in the United States?
Percentage of Population Employed in Arts, Entertainment & Recreation in the United States is 2.1%.