Zip Codes with the Highest Percentage of Renter-Occupied Units in Oklahoma City, OK

RELATED REPORTS & OPTIONS

Highest Renter-Occupied
Population
Families and Households
Female Fertility
Female Fertility (Unmarried)
Race (Community Size)
Race (Percentage)
Ancestry (Community Size)
AfricanAlaska NativeAlbanianAmericanApacheArabArapahoArgentineanArmenianAustralianAustrianBahamianBangladeshiBarbadianBasqueBelgianBhutaneseBlackfeetBolivianBrazilianBritishBritish West IndianBulgarianBurmeseCajunCambodianCanadianCelticCentral AmericanCentral American IndianCherokeeCheyenneChickasawChileanChippewaChoctawColombianComancheCreeCreekCroatianCubanCzechCzechoslovakianDanishDelawareDominicanDutchDutch West IndianEastern EuropeanEcuadorianEgyptianEnglishEstonianEthiopianEuropeanFijianFilipinoFinnishFrenchFrench American IndianFrench CanadianGermanGerman RussianGhanaianGreekGuamanian / ChamorroGuatemalanGuyaneseHaitianHonduranHopiHungarianIcelanderIndian (Asian)IndonesianInupiatIranianIraqiIrishIroquoisIsraeliItalianJamaicanJapaneseJordanianKenyanKiowaKoreanLaotianLatvianLebaneseLiberianLithuanianLuxembourgerMalaysianMexicanMexican American IndianMongolianMoroccanNative HawaiianNavajoNew ZealanderNicaraguanNigerianNorthern EuropeanNorwegianOkinawanOsagePakistaniPalestinianPanamanianPennsylvania GermanPeruvianPimaPolishPortuguesePotawatomiPuebloPuerto RicanRomanianRussianSalvadoranSamoanScandinavianScotch-IrishScottishSeminoleSerbianSiouxSlavicSlovakSloveneSouth AfricanSouth AmericanSouth American IndianSpaniardSpanishSpanish American IndianSri LankanSubsaharan AfricanSudaneseSwedishSwissSyrianThaiTlingit-HaidaTonganTrinidadian and TobagonianTurkishU.S. Virgin IslanderUkrainianUruguayanVenezuelanVietnameseWelshWest IndianYugoslavianZimbabwean
Ancestry (Percentage)
AfricanAlaska NativeAlbanianAmericanApacheArabArapahoArgentineanArmenianAustralianAustrianBahamianBangladeshiBarbadianBasqueBelgianBhutaneseBlackfeetBolivianBrazilianBritishBritish West IndianBulgarianBurmeseCajunCambodianCanadianCelticCentral AmericanCentral American IndianCherokeeCheyenneChickasawChileanChippewaChoctawColombianComancheCreeCreekCroatianCubanCzechCzechoslovakianDanishDelawareDominicanDutchDutch West IndianEastern EuropeanEcuadorianEgyptianEnglishEstonianEthiopianEuropeanFijianFilipinoFinnishFrenchFrench American IndianFrench CanadianGermanGerman RussianGhanaianGreekGuamanian / ChamorroGuatemalanGuyaneseHaitianHonduranHopiHungarianIcelanderIndian (Asian)IndonesianInupiatIranianIraqiIrishIroquoisIsraeliItalianJamaicanJapaneseJordanianKenyanKiowaKoreanLaotianLatvianLebaneseLiberianLithuanianLuxembourgerMalaysianMexicanMexican American IndianMongolianMoroccanNative HawaiianNavajoNew ZealanderNicaraguanNigerianNorthern EuropeanNorwegianOkinawanOsagePakistaniPalestinianPanamanianPennsylvania GermanPeruvianPimaPolishPortuguesePotawatomiPuebloPuerto RicanRomanianRussianSalvadoranSamoanScandinavianScotch-IrishScottishSeminoleSerbianSiouxSlavicSlovakSloveneSouth AfricanSouth AmericanSouth American IndianSpaniardSpanishSpanish American IndianSri LankanSubsaharan AfricanSudaneseSwedishSwissSyrianThaiTlingit-HaidaTonganTrinidadian and TobagonianTurkishU.S. Virgin IslanderUkrainianUruguayanVenezuelanVietnameseWelshWest IndianYugoslavianZimbabwean
Immigrant Origin (Total)
AfricaArgentinaAsiaAustraliaAustriaBahamasBangladeshBosnia and HerzegovinaBrazilBulgariaBurma / MyanmarCambodiaCameroonCanadaCaribbeanCentral AmericaChileChinaColombiaCubaDominican RepublicEastern AfricaEastern AsiaEastern EuropeEcuadorEgyptEl SalvadorEnglandEritreaEthiopiaEuropeFranceGermanyGhanaGreeceGuatemalaHondurasHong KongIndiaIndonesiaIranIraqIrelandItalyJamaicaJapanJordanKazakhstanKenyaKoreaKuwaitLaosLatin AmericaLebanonLiberiaMalaysiaMexicoMiddle AfricaMoroccoNepalNetherlandsNicaraguaNigeriaNorthern AfricaNorthern EuropeNorwayOceaniaPakistanPanamaPeruPhilippinesPolandPortugalRussiaSaudi ArabiaScotlandSingaporeSouth AfricaSouth AmericaSouth Central AsiaSouth Eastern AsiaSouthern EuropeSpainSudanSyriaTaiwanThailandTrinidad and TobagoTurkeyUkraineVenezuelaVietnamWestern AfricaWestern AsiaWestern EuropeZaireZimbabwe
Immigrant Origin (Percentage)
AfricaArgentinaAsiaAustraliaAustriaBahamasBangladeshBosnia and HerzegovinaBrazilBulgariaBurma / MyanmarCambodiaCameroonCanadaCaribbeanCentral AmericaChileChinaColombiaCubaDominican RepublicEastern AfricaEastern AsiaEastern EuropeEcuadorEgyptEl SalvadorEnglandEritreaEthiopiaEuropeFranceGermanyGhanaGreeceGuatemalaHondurasHong KongIndiaIndonesiaIranIraqIrelandItalyJamaicaJapanJordanKazakhstanKenyaKoreaKuwaitLaosLatin AmericaLebanonLiberiaMalaysiaMexicoMiddle AfricaMoroccoNepalNetherlandsNicaraguaNigeriaNorthern AfricaNorthern EuropeNorwayOceaniaPakistanPanamaPeruPhilippinesPolandPortugalRussiaSaudi ArabiaScotlandSingaporeSouth AfricaSouth AmericaSouth Central AsiaSouth Eastern AsiaSouthern EuropeSpainSudanSyriaTaiwanThailandTrinidad and TobagoTurkeyUkraineVenezuelaVietnamWestern AfricaWestern AsiaWestern EuropeZaireZimbabwe
Income
Income (Families)
Income (Households)
Poverty
Poverty (Families)
Unemployment
Employment Occupations
Employment Industries
Employer Class
Commute Time
Commute Means
School Enrollment
Education by Degree Field
Occupancy
Finances
Physical Characteristics
Oklahoma City
Compare Zip Codes
Comparison Subject

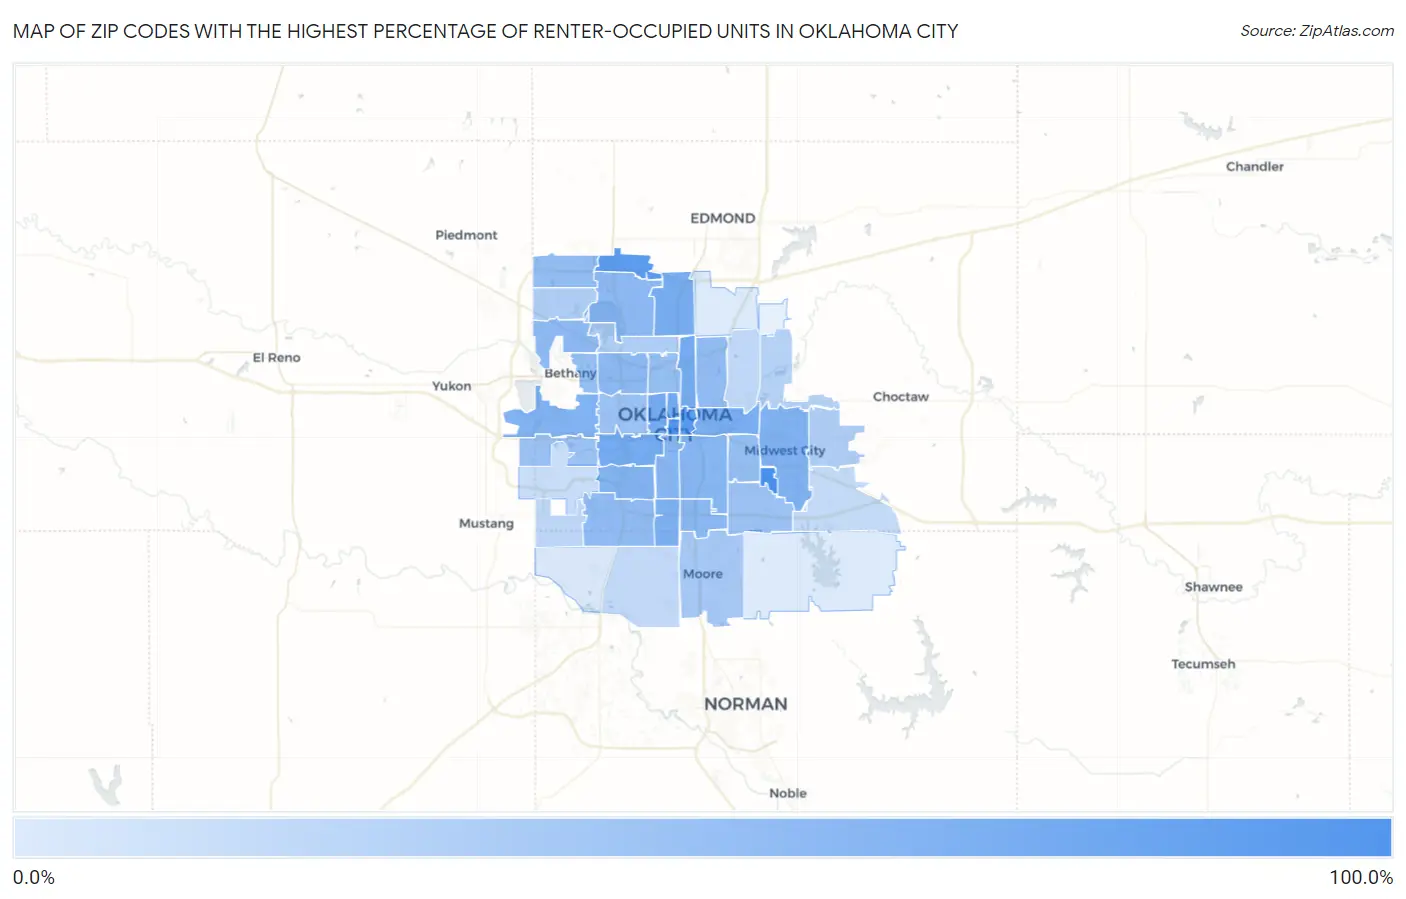
Map of Zip Codes with the Highest Percentage of Renter-Occupied Units in Oklahoma City

0.0%
100.0%
Zip Codes with the Highest Percentage of Renter-Occupied Units in Oklahoma City Map

Zip Codes with the Highest Percentage of Renter-Occupied Units in Oklahoma City, OK

Zip Code % Renter-Occupied vs State vs National
1.7314598.7%34.1%(+64.6)#635.2%(+63.5)#335
2.7310291.7%34.1%(+57.7)#735.2%(+56.6)#432
3.7310483.0%34.1%(+49.0)#835.2%(+47.8)#603
4.7313481.5%34.1%(+47.5)#935.2%(+46.4)#632
5.7310366.8%34.1%(+32.8)#1335.2%(+31.6)#1,245
6.7310863.5%34.1%(+29.5)#1735.2%(+28.3)#1,509
7.7310663.4%34.1%(+29.4)#1835.2%(+28.2)#1,518
8.7310562.6%34.1%(+28.5)#2135.2%(+27.4)#1,583
9.7311462.4%34.1%(+28.4)#2235.2%(+27.3)#1,598
10.7311759.6%34.1%(+25.5)#2435.2%(+24.4)#1,848
11.7313957.6%34.1%(+23.6)#2635.2%(+22.4)#2,036
12.7311056.0%34.1%(+22.0)#2935.2%(+20.8)#2,206
13.7312755.6%34.1%(+21.5)#3035.2%(+20.4)#2,252
14.7311953.7%34.1%(+19.6)#3535.2%(+18.5)#2,515
15.7310951.6%34.1%(+17.5)#4235.2%(+16.4)#2,837
16.7312951.3%34.1%(+17.2)#4335.2%(+16.1)#2,882
17.7314949.0%34.1%(+14.9)#4535.2%(+13.8)#3,276
18.7311248.5%34.1%(+14.4)#4835.2%(+13.3)#3,362
19.7312047.9%34.1%(+13.8)#5135.2%(+12.7)#3,467
20.7313247.2%34.1%(+13.2)#5335.2%(+12.1)#3,595
21.7315945.4%34.1%(+11.3)#5935.2%(+10.2)#3,974
22.7311144.8%34.1%(+10.8)#6335.2%(+9.66)#4,098
23.7314243.3%34.1%(+9.24)#7135.2%(+8.12)#4,496
24.7311843.0%34.1%(+8.97)#7335.2%(+7.85)#4,567
25.7312242.6%34.1%(+8.53)#7435.2%(+7.41)#4,693
26.7311542.2%34.1%(+8.10)#7835.2%(+6.98)#4,796
27.7313539.9%34.1%(+5.81)#9235.2%(+4.69)#5,446
28.7310738.7%34.1%(+4.65)#9835.2%(+3.53)#5,817
29.7312837.6%34.1%(+3.58)#10635.2%(+2.45)#6,223
30.7316033.4%34.1%(-0.618)#13735.2%(-1.74)#8,089
31.7311628.2%34.1%(-5.90)#21335.2%(-7.02)#11,286
32.7313027.7%34.1%(-6.39)#21935.2%(-7.52)#11,621
33.7316227.5%34.1%(-6.53)#22135.2%(-7.65)#11,712
34.7314123.8%34.1%(-10.3)#31335.2%(-11.4)#14,741
35.7316920.2%34.1%(-13.9)#38935.2%(-15.0)#18,017
36.7312118.8%34.1%(-15.3)#42635.2%(-16.4)#19,368
37.7317018.8%34.1%(-15.3)#42835.2%(-16.4)#19,410
38.7315017.2%34.1%(-16.9)#47135.2%(-18.0)#21,010
39.7317915.1%34.1%(-19.0)#50935.2%(-20.1)#23,032
40.731736.8%34.1%(-27.3)#62035.2%(-28.4)#29,296
41.731315.5%34.1%(-28.6)#63135.2%(-29.7)#29,888
42.731655.1%34.1%(-29.0)#63335.2%(-30.1)#30,043

Common Questions

What are the Top 10 Zip Codes with the Highest Percentage of Renter-Occupied Units in Oklahoma City, OK?
Top 10 Zip Codes with the Highest Percentage of Renter-Occupied Units in Oklahoma City, OK are:
#1
98.7%
#2
91.7%
#3
83.0%
#4
81.5%
#5
66.8%
#6
63.5%
#7
63.4%
#8
62.6%
#9
62.4%
#10
59.6%
What zip code has the Highest Percentage of Renter-Occupied Units in Oklahoma City, OK?
73145 has the Highest Percentage of Renter-Occupied Units in Oklahoma City, OK with 98.7%.
What is the Percentage of Renter-Occupied Units in Oklahoma City, OK?
Percentage of Renter-Occupied Units in Oklahoma City is 40.5%.
What is the Percentage of Renter-Occupied Units in Oklahoma?
Percentage of Renter-Occupied Units in Oklahoma is 34.1%.
What is the Percentage of Renter-Occupied Units in the United States?
Percentage of Renter-Occupied Units in the United States is 35.2%.