Zip Codes with the Highest Percentage of Households Residing in Condos/Apartments in Oklahoma City, OK

RELATED REPORTS & OPTIONS

Condo/Apartment Residency
Population
Families and Households
Female Fertility
Female Fertility (Unmarried)
Race (Community Size)
Race (Percentage)
Ancestry (Community Size)
AfricanAlaska NativeAlbanianAmericanApacheArabArapahoArgentineanArmenianAustralianAustrianBahamianBangladeshiBarbadianBasqueBelgianBhutaneseBlackfeetBolivianBrazilianBritishBritish West IndianBulgarianBurmeseCajunCambodianCanadianCelticCentral AmericanCentral American IndianCherokeeCheyenneChickasawChileanChippewaChoctawColombianComancheCreeCreekCroatianCubanCzechCzechoslovakianDanishDelawareDominicanDutchDutch West IndianEastern EuropeanEcuadorianEgyptianEnglishEstonianEthiopianEuropeanFijianFilipinoFinnishFrenchFrench American IndianFrench CanadianGermanGerman RussianGhanaianGreekGuamanian / ChamorroGuatemalanGuyaneseHaitianHonduranHopiHungarianIcelanderIndian (Asian)IndonesianInupiatIranianIraqiIrishIroquoisIsraeliItalianJamaicanJapaneseJordanianKenyanKiowaKoreanLaotianLatvianLebaneseLiberianLithuanianLuxembourgerMalaysianMexicanMexican American IndianMongolianMoroccanNative HawaiianNavajoNew ZealanderNicaraguanNigerianNorthern EuropeanNorwegianOkinawanOsagePakistaniPalestinianPanamanianPennsylvania GermanPeruvianPimaPolishPortuguesePotawatomiPuebloPuerto RicanRomanianRussianSalvadoranSamoanScandinavianScotch-IrishScottishSeminoleSerbianSiouxSlavicSlovakSloveneSouth AfricanSouth AmericanSouth American IndianSpaniardSpanishSpanish American IndianSri LankanSubsaharan AfricanSudaneseSwedishSwissSyrianThaiTlingit-HaidaTonganTrinidadian and TobagonianTurkishU.S. Virgin IslanderUkrainianUruguayanVenezuelanVietnameseWelshWest IndianYugoslavianZimbabwean
Ancestry (Percentage)
AfricanAlaska NativeAlbanianAmericanApacheArabArapahoArgentineanArmenianAustralianAustrianBahamianBangladeshiBarbadianBasqueBelgianBhutaneseBlackfeetBolivianBrazilianBritishBritish West IndianBulgarianBurmeseCajunCambodianCanadianCelticCentral AmericanCentral American IndianCherokeeCheyenneChickasawChileanChippewaChoctawColombianComancheCreeCreekCroatianCubanCzechCzechoslovakianDanishDelawareDominicanDutchDutch West IndianEastern EuropeanEcuadorianEgyptianEnglishEstonianEthiopianEuropeanFijianFilipinoFinnishFrenchFrench American IndianFrench CanadianGermanGerman RussianGhanaianGreekGuamanian / ChamorroGuatemalanGuyaneseHaitianHonduranHopiHungarianIcelanderIndian (Asian)IndonesianInupiatIranianIraqiIrishIroquoisIsraeliItalianJamaicanJapaneseJordanianKenyanKiowaKoreanLaotianLatvianLebaneseLiberianLithuanianLuxembourgerMalaysianMexicanMexican American IndianMongolianMoroccanNative HawaiianNavajoNew ZealanderNicaraguanNigerianNorthern EuropeanNorwegianOkinawanOsagePakistaniPalestinianPanamanianPennsylvania GermanPeruvianPimaPolishPortuguesePotawatomiPuebloPuerto RicanRomanianRussianSalvadoranSamoanScandinavianScotch-IrishScottishSeminoleSerbianSiouxSlavicSlovakSloveneSouth AfricanSouth AmericanSouth American IndianSpaniardSpanishSpanish American IndianSri LankanSubsaharan AfricanSudaneseSwedishSwissSyrianThaiTlingit-HaidaTonganTrinidadian and TobagonianTurkishU.S. Virgin IslanderUkrainianUruguayanVenezuelanVietnameseWelshWest IndianYugoslavianZimbabwean
Immigrant Origin (Total)
AfricaArgentinaAsiaAustraliaAustriaBahamasBangladeshBosnia and HerzegovinaBrazilBulgariaBurma / MyanmarCambodiaCameroonCanadaCaribbeanCentral AmericaChileChinaColombiaCubaDominican RepublicEastern AfricaEastern AsiaEastern EuropeEcuadorEgyptEl SalvadorEnglandEritreaEthiopiaEuropeFranceGermanyGhanaGreeceGuatemalaHondurasHong KongIndiaIndonesiaIranIraqIrelandItalyJamaicaJapanJordanKazakhstanKenyaKoreaKuwaitLaosLatin AmericaLebanonLiberiaMalaysiaMexicoMiddle AfricaMoroccoNepalNetherlandsNicaraguaNigeriaNorthern AfricaNorthern EuropeNorwayOceaniaPakistanPanamaPeruPhilippinesPolandPortugalRussiaSaudi ArabiaScotlandSingaporeSouth AfricaSouth AmericaSouth Central AsiaSouth Eastern AsiaSouthern EuropeSpainSudanSyriaTaiwanThailandTrinidad and TobagoTurkeyUkraineVenezuelaVietnamWestern AfricaWestern AsiaWestern EuropeZaireZimbabwe
Immigrant Origin (Percentage)
AfricaArgentinaAsiaAustraliaAustriaBahamasBangladeshBosnia and HerzegovinaBrazilBulgariaBurma / MyanmarCambodiaCameroonCanadaCaribbeanCentral AmericaChileChinaColombiaCubaDominican RepublicEastern AfricaEastern AsiaEastern EuropeEcuadorEgyptEl SalvadorEnglandEritreaEthiopiaEuropeFranceGermanyGhanaGreeceGuatemalaHondurasHong KongIndiaIndonesiaIranIraqIrelandItalyJamaicaJapanJordanKazakhstanKenyaKoreaKuwaitLaosLatin AmericaLebanonLiberiaMalaysiaMexicoMiddle AfricaMoroccoNepalNetherlandsNicaraguaNigeriaNorthern AfricaNorthern EuropeNorwayOceaniaPakistanPanamaPeruPhilippinesPolandPortugalRussiaSaudi ArabiaScotlandSingaporeSouth AfricaSouth AmericaSouth Central AsiaSouth Eastern AsiaSouthern EuropeSpainSudanSyriaTaiwanThailandTrinidad and TobagoTurkeyUkraineVenezuelaVietnamWestern AfricaWestern AsiaWestern EuropeZaireZimbabwe
Income
Income (Families)
Income (Households)
Poverty
Poverty (Families)
Unemployment
Employment Occupations
Employment Industries
Employer Class
Commute Time
Commute Means
School Enrollment
Education by Degree Field
Occupancy
Finances
Physical Characteristics
Oklahoma City
Compare Zip Codes
Comparison Subject

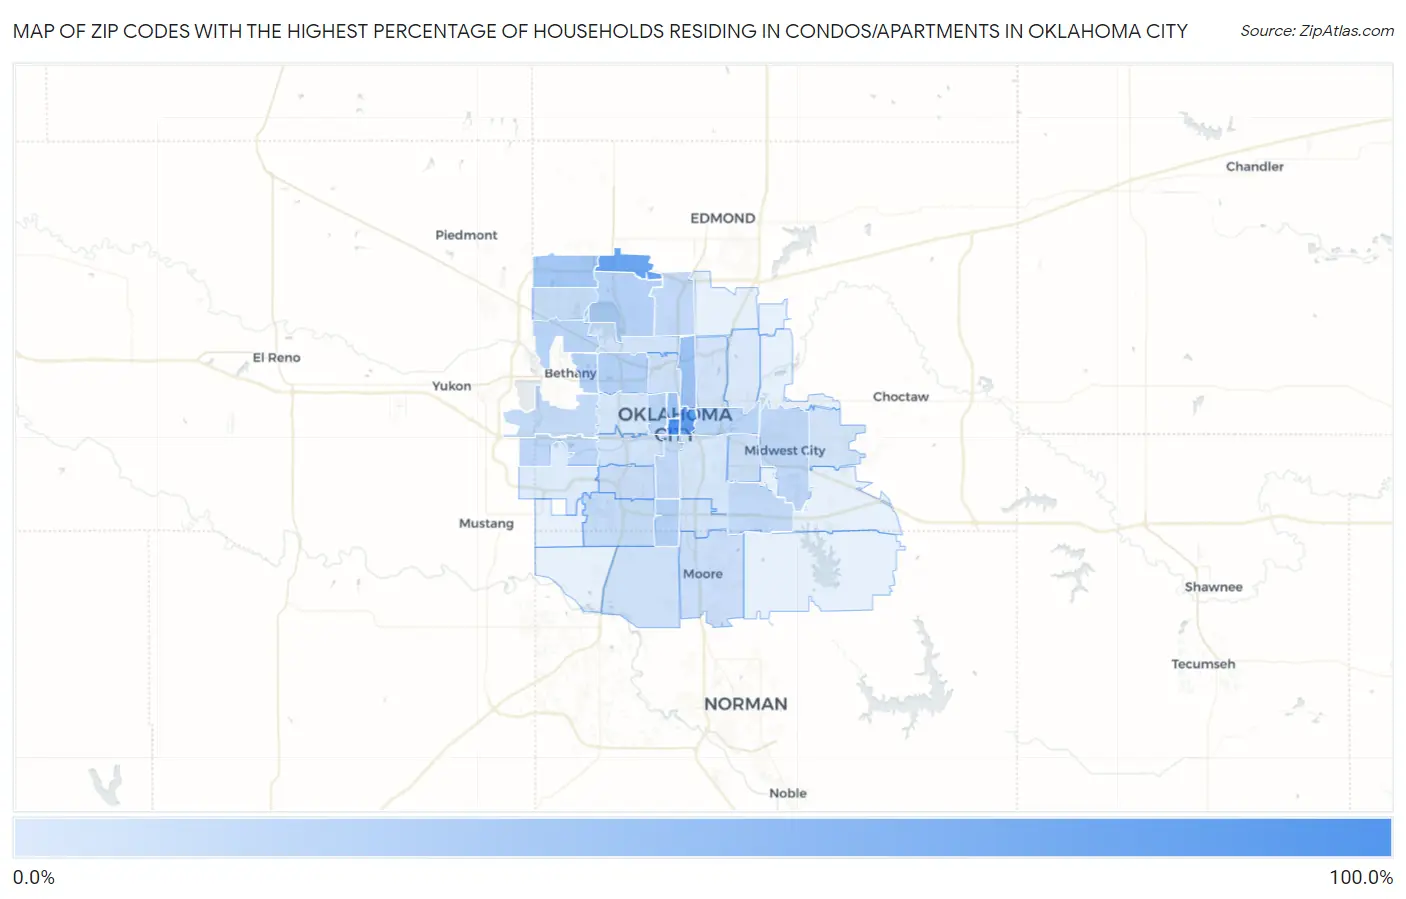
Map of Zip Codes with the Highest Percentage of Households Residing in Condos/Apartments in Oklahoma City

0.0%
100.0%
Zip Codes with the Highest Percentage of Households Residing in Condos/Apartments in Oklahoma City Map

Zip Codes with the Highest Percentage of Households Residing in Condos/Apartments in Oklahoma City, OK

Zip Code Detached Home Residency vs State vs National
1.7310284.7%7.5%(+77.2)#213.8%(+70.9)#203
2.7310465.9%7.5%(+58.4)#413.8%(+52.1)#373
3.7313460.5%7.5%(+53.0)#513.8%(+46.7)#437
4.7310530.2%7.5%(+22.7)#713.8%(+16.4)#1,282
5.7310329.1%7.5%(+21.6)#913.8%(+15.3)#1,358
6.7314226.7%7.5%(+19.2)#1313.8%(+12.9)#1,563
7.7312019.2%7.5%(+11.7)#1613.8%(+5.40)#2,585
8.7311218.7%7.5%(+11.2)#1813.8%(+4.90)#2,694
9.7312218.1%7.5%(+10.6)#2013.8%(+4.30)#2,817
10.7313917.9%7.5%(+10.4)#2113.8%(+4.10)#2,855
11.7310616.6%7.5%(+9.10)#2513.8%(+2.80)#3,151
12.7313215.6%7.5%(+8.10)#2813.8%(+1.80)#3,414
13.7311715.5%7.5%(+8.00)#2913.8%(+1.70)#3,454
14.7311013.7%7.5%(+6.20)#3413.8%(-0.100)#3,996
15.7312813.4%7.5%(+5.90)#3513.8%(-0.400)#4,110
16.7313511.9%7.5%(+4.40)#3913.8%(-1.90)#4,645
17.7311411.9%7.5%(+4.40)#4013.8%(-1.90)#4,648
18.7310911.8%7.5%(+4.30)#4213.8%(-2.00)#4,686
19.7312711.5%7.5%(+4.00)#4313.8%(-2.30)#4,810
20.7316210.4%7.5%(+2.90)#4713.8%(-3.40)#5,295
21.731599.7%7.5%(+2.20)#5113.8%(-4.10)#5,637
22.731198.5%7.5%(+1.00)#5713.8%(-5.30)#6,322
23.731608.2%7.5%(+0.700)#6013.8%(-5.60)#6,515
24.731187.4%7.5%(-0.100)#6913.8%(-6.40)#7,101
25.731156.7%7.5%(-0.800)#7513.8%(-7.10)#7,615
26.731706.0%7.5%(-1.50)#8213.8%(-7.80)#8,187
27.731085.3%7.5%(-2.20)#8613.8%(-8.50)#8,849
28.731115.2%7.5%(-2.30)#8813.8%(-8.60)#8,952
29.731165.1%7.5%(-2.40)#8913.8%(-8.70)#9,039
30.731495.1%7.5%(-2.40)#9013.8%(-8.70)#9,051
31.731303.6%7.5%(-3.90)#11413.8%(-10.2)#10,721
32.731293.3%7.5%(-4.20)#12113.8%(-10.5)#11,138
33.731072.8%7.5%(-4.70)#13313.8%(-11.0)#11,902
34.731211.0%7.5%(-6.50)#20613.8%(-12.8)#15,682
35.731790.20%7.5%(-7.30)#29213.8%(-13.6)#18,000

Common Questions

What are the Top 10 Zip Codes with the Highest Percentage of Households Residing in Condos/Apartments in Oklahoma City, OK?
Top 10 Zip Codes with the Highest Percentage of Households Residing in Condos/Apartments in Oklahoma City, OK are:
#1
84.7%
#2
65.9%
#3
60.5%
#4
30.2%
#5
29.1%
#6
26.7%
#7
19.2%
#8
18.7%
#9
18.1%
#10
17.9%
What zip code has the Highest Percentage of Households Residing in Condos/Apartments in Oklahoma City, OK?
73102 has the Highest Percentage of Households Residing in Condos/Apartments in Oklahoma City, OK with 84.7%.
What is the Percentage of Households Residing in Condos/Apartments in Oklahoma City, OK?
Percentage of Households Residing in Condos/Apartments in Oklahoma City is 12.2%.
What is the Percentage of Households Residing in Condos/Apartments in Oklahoma?
Percentage of Households Residing in Condos/Apartments in Oklahoma is 7.5%.
What is the Percentage of Households Residing in Condos/Apartments in the United States?
Percentage of Households Residing in Condos/Apartments in the United States is 13.8%.