Zip Codes with the Highest Percentage of Self-Employed / Incorporated in Youngstown, OH

RELATED REPORTS & OPTIONS

Self-Employed / Incorporated
Population
Families and Households
Female Fertility
Female Fertility (Unmarried)
Race (Community Size)
Race (Percentage)
Ancestry (Community Size)
AfricanAmericanApacheArabArmenianAustrianBarbadianBelgianBhutaneseBlackfeetBrazilianBritishBulgarianBurmeseCanadianCarpatho RusynCelticCentral AmericanCentral American IndianCherokeeColombianCreekCroatianCubanCypriotCzechCzechoslovakianDanishDominicanDutchEastern EuropeanEnglishEuropeanFinnishFrenchFrench CanadianGermanGreekGuatemalanHaitianHonduranHungarianIndian (Asian)IrishIroquoisItalianJamaicanJordanianKoreanLebaneseLithuanianMexicanMoroccanNative HawaiianNew ZealanderNicaraguanNigerianNorthern EuropeanNorwegianPakistaniPalestinianPennsylvania GermanPeruvianPolishPortuguesePuerto RicanRomanianRussianScandinavianScotch-IrishScottishSerbianSiouxSlavicSlovakSloveneSouth AmericanSpaniardSpanishSri LankanSubsaharan AfricanSwedishSwissThaiTrinidadian and TobagonianUkrainianVenezuelanWelshWest Indian
Ancestry (Percentage)
AfricanAmericanApacheArabArmenianAustrianBarbadianBelgianBhutaneseBlackfeetBrazilianBritishBulgarianBurmeseCanadianCarpatho RusynCelticCentral AmericanCentral American IndianCherokeeColombianCreekCroatianCubanCypriotCzechCzechoslovakianDanishDominicanDutchEastern EuropeanEnglishEuropeanFinnishFrenchFrench CanadianGermanGreekGuatemalanHaitianHonduranHungarianIndian (Asian)IrishIroquoisItalianJamaicanJordanianKoreanLebaneseLithuanianMexicanMoroccanNative HawaiianNew ZealanderNicaraguanNigerianNorthern EuropeanNorwegianPakistaniPalestinianPennsylvania GermanPeruvianPolishPortuguesePuerto RicanRomanianRussianScandinavianScotch-IrishScottishSerbianSiouxSlavicSlovakSloveneSouth AmericanSpaniardSpanishSri LankanSubsaharan AfricanSwedishSwissThaiTrinidadian and TobagonianUkrainianVenezuelanWelshWest Indian
Immigrant Origin (Total)
Immigrant Origin (Percentage)
Income
Income (Families)
Income (Households)
Poverty
Poverty (Families)
Unemployment
Employment Occupations
Employment Industries
Employer Class
Commute Time
Commute Means
School Enrollment
Education by Degree Field
Occupancy
Finances
Physical Characteristics
Youngstown
Compare Zip Codes
Comparison Subject

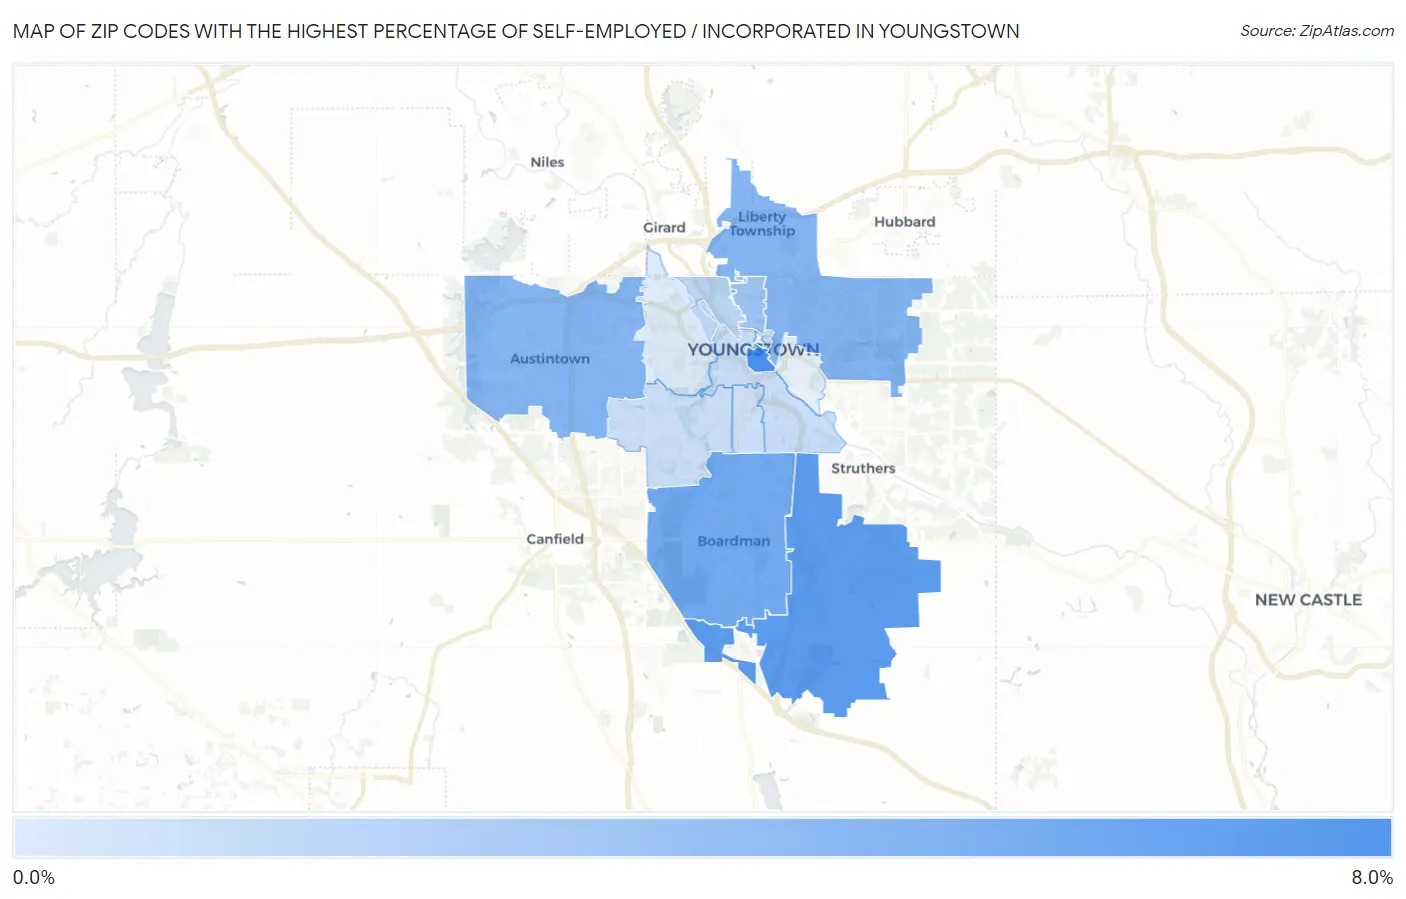
Map of Zip Codes with the Highest Percentage of Self-Employed / Incorporated in Youngstown

0.0%
8.0%
Zip Codes with the Highest Percentage of Self-Employed / Incorporated in Youngstown Map

Zip Codes with the Highest Percentage of Self-Employed / Incorporated in Youngstown, OH

Zip Code % Self-Employed / Incorporated vs State vs National
1.445036.6%3.0%(+3.54)#923.8%(+2.75)#5,396
2.445145.8%3.0%(+2.76)#1283.8%(+1.97)#6,739
3.445125.0%3.0%(+1.94)#1773.8%(+1.15)#8,691
4.445054.4%3.0%(+1.33)#2333.8%(+0.544)#10,581
5.445154.2%3.0%(+1.20)#2463.8%(+0.415)#11,067
6.445043.3%3.0%(+0.317)#3663.8%(-0.471)#14,745
7.445102.2%3.0%(-0.816)#6043.8%(-1.60)#20,300
8.445021.7%3.0%(-1.33)#7233.8%(-2.12)#22,666
9.445111.6%3.0%(-1.42)#7443.8%(-2.21)#23,065
10.445071.6%3.0%(-1.47)#7583.8%(-2.26)#23,263
11.445091.1%3.0%(-1.97)#8703.8%(-2.76)#25,107

Common Questions

What are the Top 10 Zip Codes with the Highest Percentage of Self-Employed / Incorporated in Youngstown, OH?
Top 10 Zip Codes with the Highest Percentage of Self-Employed / Incorporated in Youngstown, OH are:
#1
6.6%
#2
5.8%
#3
5.0%
#4
4.4%
#5
4.2%
#6
3.3%
#7
2.2%
#8
1.7%
#9
1.6%
#10
1.6%
What zip code has the Highest Percentage of Self-Employed / Incorporated in Youngstown, OH?
44503 has the Highest Percentage of Self-Employed / Incorporated in Youngstown, OH with 6.6%.
What is the Percentage of Self-Employed / Incorporated in Youngstown, OH?
Percentage of Self-Employed / Incorporated in Youngstown is 1.4%.
What is the Percentage of Self-Employed / Incorporated in Ohio?
Percentage of Self-Employed / Incorporated in Ohio is 3.0%.
What is the Percentage of Self-Employed / Incorporated in the United States?
Percentage of Self-Employed / Incorporated in the United States is 3.8%.