Zip Codes with the Highest Percentage of Population Employed in Health Care & Social Assistance in Westerville, OH
RELATED REPORTS & OPTIONS
Health Care & Social Assistance
Westerville
Compare Zip Codes
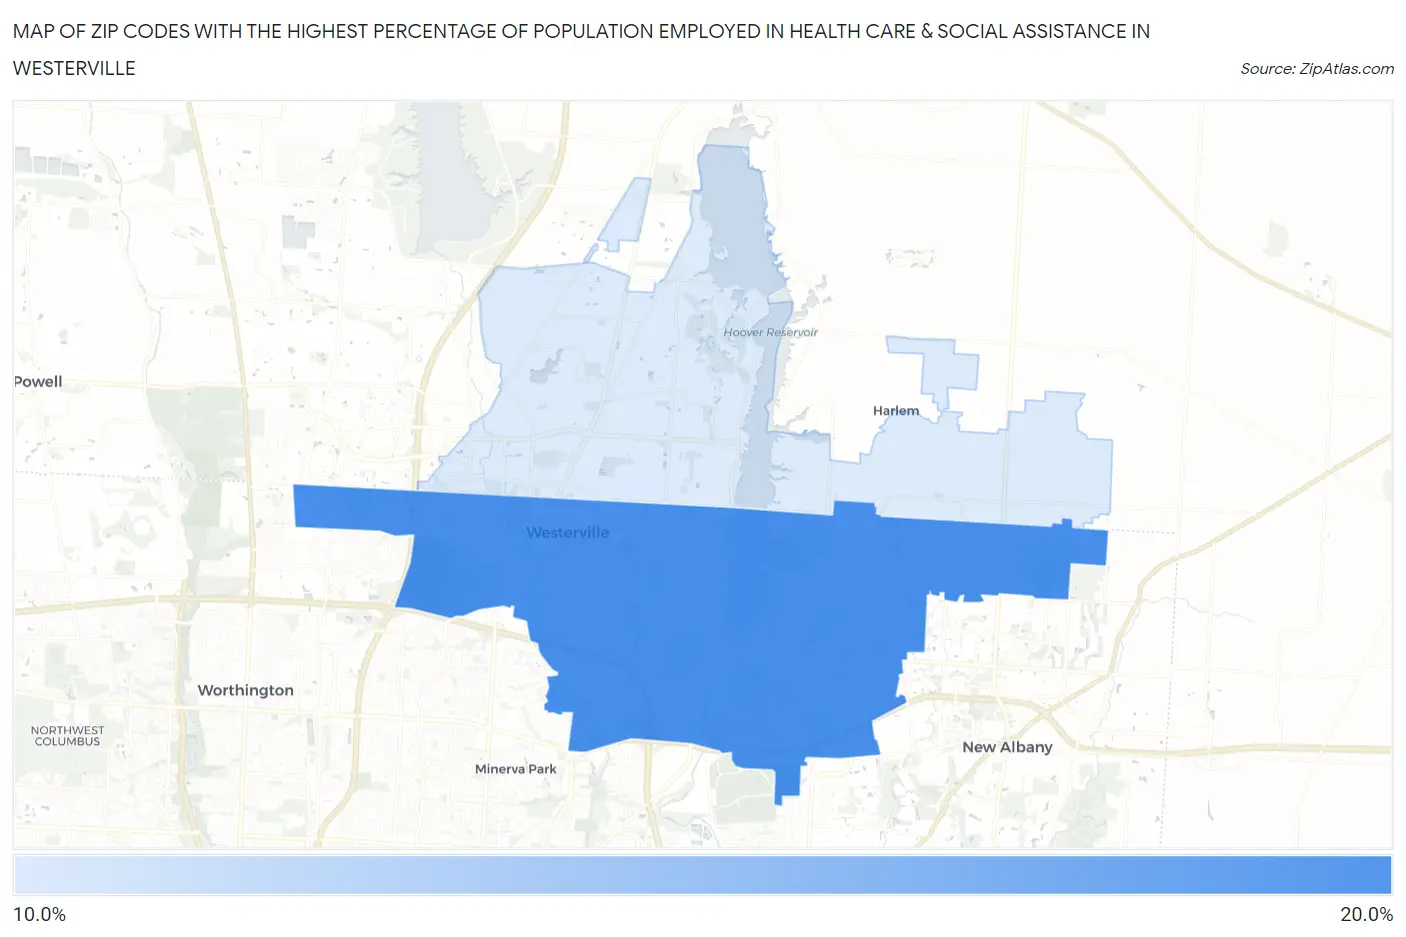
Map of Zip Codes with the Highest Percentage of Population Employed in Health Care & Social Assistance in Westerville
0.0%
20.0%
Zip Codes with the Highest Percentage of Population Employed in Health Care & Social Assistance in Westerville, OH
| Zip Code | % Employed | vs State | vs National | |
| 1. | 43081 | 15.1% | 15.7%(-0.594)#582 | 13.9%(+1.14)#11,477 |
| 2. | 43082 | 12.3% | 15.7%(-3.35)#816 | 13.9%(-1.61)#18,288 |
1
Common Questions
What are the Top Zip Codes with the Highest Percentage of Population Employed in Health Care & Social Assistance in Westerville, OH?
Top Zip Codes with the Highest Percentage of Population Employed in Health Care & Social Assistance in Westerville, OH are:
What zip code has the Highest Percentage of Population Employed in Health Care & Social Assistance in Westerville, OH?
43081 has the Highest Percentage of Population Employed in Health Care & Social Assistance in Westerville, OH with 15.1%.
What is the Percentage of Population Employed in Health Care & Social Assistance in Westerville, OH?
Percentage of Population Employed in Health Care & Social Assistance in Westerville is 15.6%.
What is the Percentage of Population Employed in Health Care & Social Assistance in Ohio?
Percentage of Population Employed in Health Care & Social Assistance in Ohio is 15.7%.
What is the Percentage of Population Employed in Health Care & Social Assistance in the United States?
Percentage of Population Employed in Health Care & Social Assistance in the United States is 13.9%.