Zip Codes with the Highest Percentage of Population Employed in Arts, Entertainment & Recreation in Westerville, OH
RELATED REPORTS & OPTIONS
Arts, Entertainment & Recreation
Westerville
Compare Zip Codes
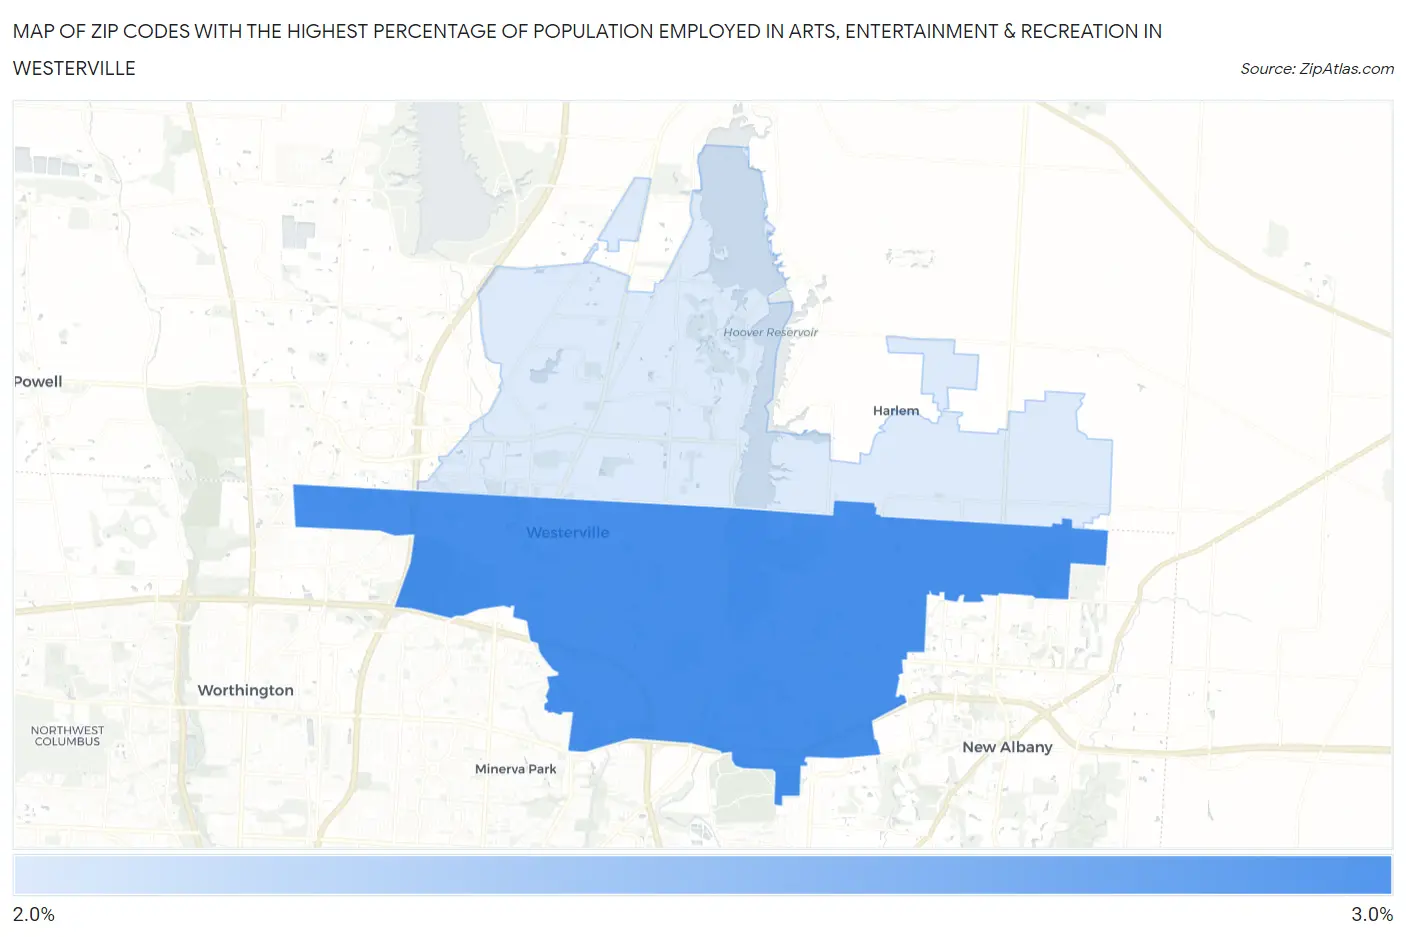
Map of Zip Codes with the Highest Percentage of Population Employed in Arts, Entertainment & Recreation in Westerville
0.0%
3.0%
Zip Codes with the Highest Percentage of Population Employed in Arts, Entertainment & Recreation in Westerville, OH
| Zip Code | % Employed | vs State | vs National | |
| 1. | 43081 | 2.8% | 1.7%(+1.16)#119 | 2.1%(+0.753)#5,868 |
| 2. | 43082 | 2.6% | 1.7%(+0.963)#145 | 2.1%(+0.559)#6,601 |
1
Common Questions
What are the Top Zip Codes with the Highest Percentage of Population Employed in Arts, Entertainment & Recreation in Westerville, OH?
Top Zip Codes with the Highest Percentage of Population Employed in Arts, Entertainment & Recreation in Westerville, OH are:
What zip code has the Highest Percentage of Population Employed in Arts, Entertainment & Recreation in Westerville, OH?
43081 has the Highest Percentage of Population Employed in Arts, Entertainment & Recreation in Westerville, OH with 2.8%.
What is the Percentage of Population Employed in Arts, Entertainment & Recreation in Westerville, OH?
Percentage of Population Employed in Arts, Entertainment & Recreation in Westerville is 2.7%.
What is the Percentage of Population Employed in Arts, Entertainment & Recreation in Ohio?
Percentage of Population Employed in Arts, Entertainment & Recreation in Ohio is 1.7%.
What is the Percentage of Population Employed in Arts, Entertainment & Recreation in the United States?
Percentage of Population Employed in Arts, Entertainment & Recreation in the United States is 2.1%.