Zip Codes with the Highest Percentage of Population Employed in Agriculture, Fishing & Hunting in Westerville, OH
RELATED REPORTS & OPTIONS
Agriculture, Fishing & Hunting
Westerville
Compare Zip Codes
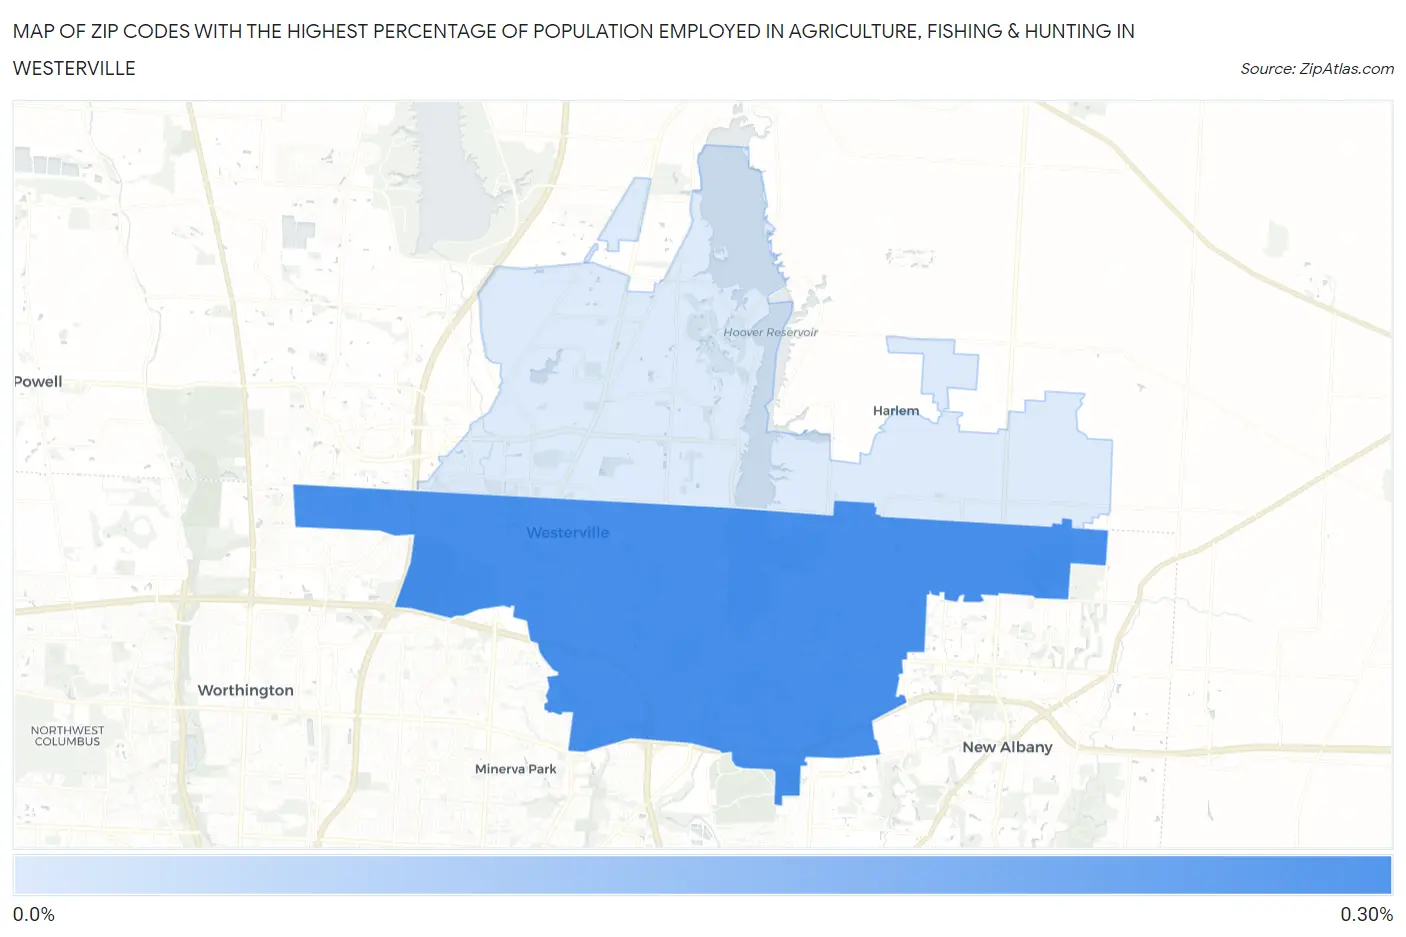
Map of Zip Codes with the Highest Percentage of Population Employed in Agriculture, Fishing & Hunting in Westerville
0.0%
0.30%
Zip Codes with the Highest Percentage of Population Employed in Agriculture, Fishing & Hunting in Westerville, OH
| Zip Code | % Employed | vs State | vs National | |
| 1. | 43081 | 0.28% | 0.71%(-0.433)#644 | 1.2%(-0.917)#21,391 |
| 2. | 43082 | 0.024% | 0.71%(-0.691)#791 | 1.2%(-1.18)#24,560 |
1
Common Questions
What are the Top Zip Codes with the Highest Percentage of Population Employed in Agriculture, Fishing & Hunting in Westerville, OH?
Top Zip Codes with the Highest Percentage of Population Employed in Agriculture, Fishing & Hunting in Westerville, OH are:
What zip code has the Highest Percentage of Population Employed in Agriculture, Fishing & Hunting in Westerville, OH?
43081 has the Highest Percentage of Population Employed in Agriculture, Fishing & Hunting in Westerville, OH with 0.28%.
What is the Percentage of Population Employed in Agriculture, Fishing & Hunting in Westerville, OH?
Percentage of Population Employed in Agriculture, Fishing & Hunting in Westerville is 0.061%.
What is the Percentage of Population Employed in Agriculture, Fishing & Hunting in Ohio?
Percentage of Population Employed in Agriculture, Fishing & Hunting in Ohio is 0.71%.
What is the Percentage of Population Employed in Agriculture, Fishing & Hunting in the United States?
Percentage of Population Employed in Agriculture, Fishing & Hunting in the United States is 1.2%.