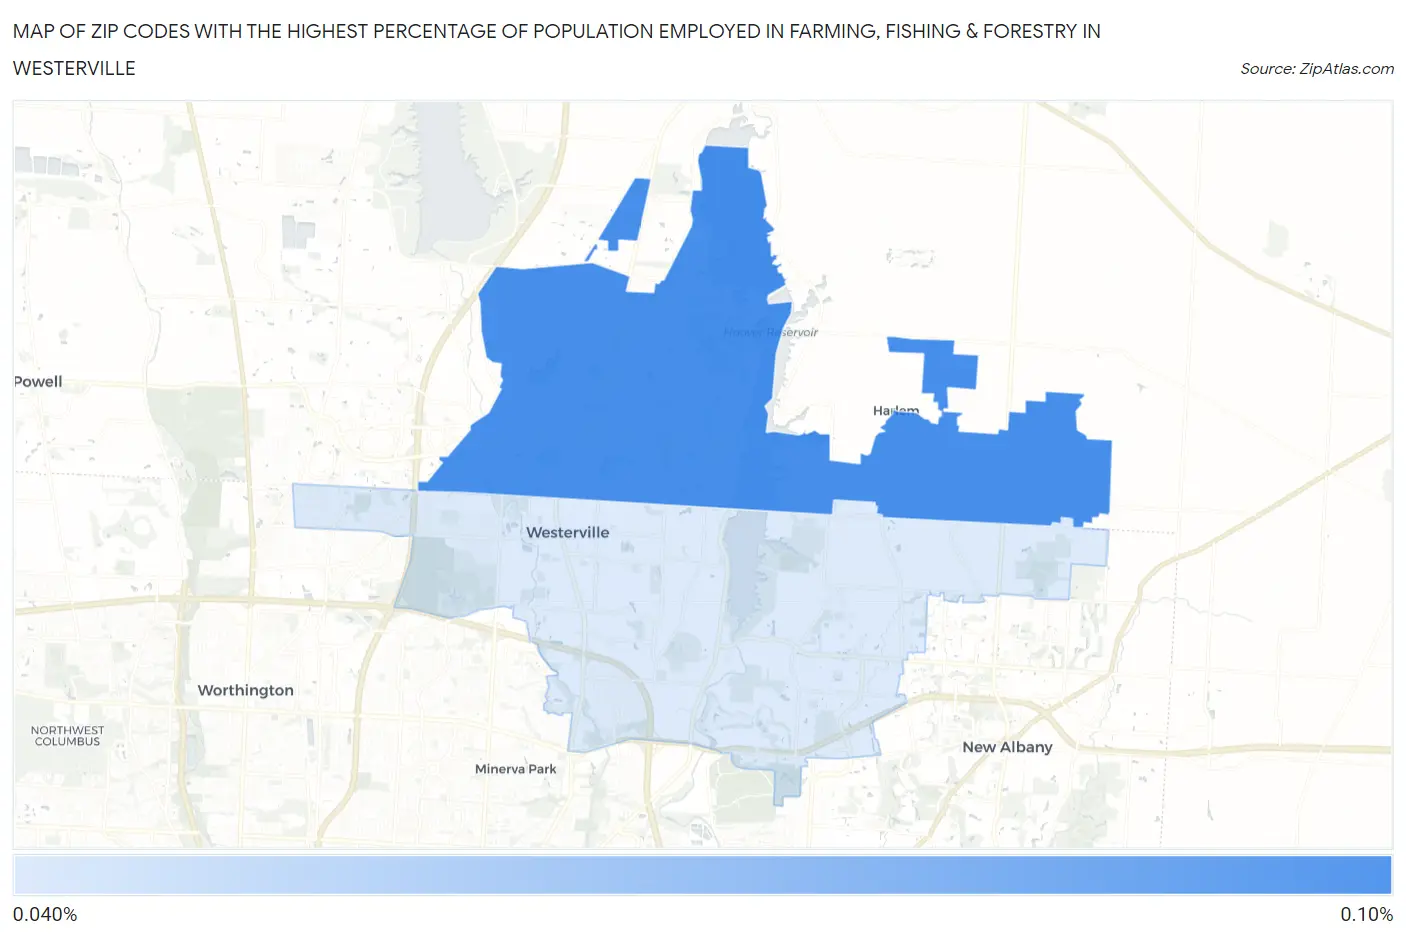
Zip Codes with the Highest Percentage of Population Employed in Farming, Fishing & Forestry in Westerville, OH
RELATED REPORTS & OPTIONS
Farming, Fishing & Forestry
Westerville
Compare Zip Codes
Map of Zip Codes with the Highest Percentage of Population Employed in Farming, Fishing & Forestry in Westerville
0.0%
0.10%
Zip Codes with the Highest Percentage of Population Employed in Farming, Fishing & Forestry in Westerville, OH
| Zip Code | % Employed | vs State | vs National | |
| 1. | 43082 | 0.096% | 0.29%(-0.193)#501 | 0.61%(-0.510)#17,839 |
| 2. | 43081 | 0.043% | 0.29%(-0.245)#551 | 0.61%(-0.562)#18,764 |
1
Common Questions
What are the Top Zip Codes with the Highest Percentage of Population Employed in Farming, Fishing & Forestry in Westerville, OH?
Top Zip Codes with the Highest Percentage of Population Employed in Farming, Fishing & Forestry in Westerville, OH are:
What zip code has the Highest Percentage of Population Employed in Farming, Fishing & Forestry in Westerville, OH?
43082 has the Highest Percentage of Population Employed in Farming, Fishing & Forestry in Westerville, OH with 0.096%.
What is the Percentage of Population Employed in Farming, Fishing & Forestry in Westerville, OH?
Percentage of Population Employed in Farming, Fishing & Forestry in Westerville is 0.16%.
What is the Percentage of Population Employed in Farming, Fishing & Forestry in Ohio?
Percentage of Population Employed in Farming, Fishing & Forestry in Ohio is 0.29%.
What is the Percentage of Population Employed in Farming, Fishing & Forestry in the United States?
Percentage of Population Employed in Farming, Fishing & Forestry in the United States is 0.61%.