Zip Codes with the Highest Percentage of Hispanic or Latino Population in Warren, OH
RELATED REPORTS & OPTIONS
Hispanic or Latino
Warren
Compare Zip Codes
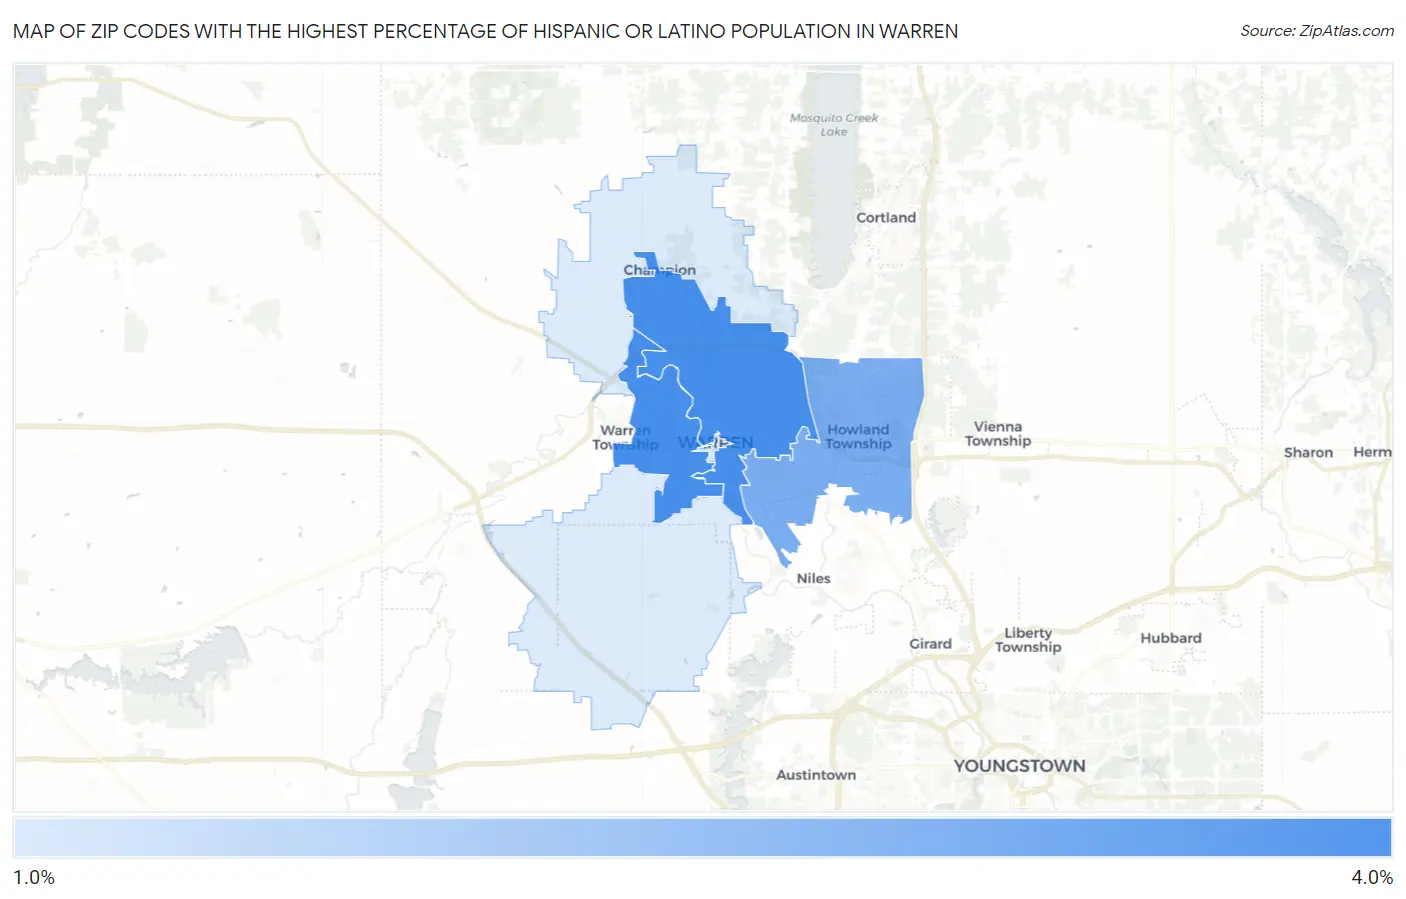
Map of Zip Codes with the Highest Percentage of Hispanic or Latino Population in Warren
1.3%
3.3%
Zip Codes with the Highest Percentage of Hispanic or Latino Population in Warren, OH
| Zip Code | Hispanic or Latino | vs State | vs National | |
| 1. | 44485 | 3.3% | 4.2%(-0.854)#366 | 18.7%(-15.3)#17,527 |
| 2. | 44483 | 3.3% | 4.2%(-0.861)#368 | 18.7%(-15.3)#17,544 |
| 3. | 44484 | 2.7% | 4.2%(-1.54)#450 | 18.7%(-16.0)#19,244 |
| 4. | 44481 | 1.3% | 4.2%(-2.87)#686 | 18.7%(-17.3)#23,061 |
1
Common Questions
What are the Top 3 Zip Codes with the Highest Percentage of Hispanic or Latino Population in Warren, OH?
Top 3 Zip Codes with the Highest Percentage of Hispanic or Latino Population in Warren, OH are:
What zip code has the Highest Percentage of Hispanic or Latino Population in Warren, OH?
44485 has the Highest Percentage of Hispanic or Latino Population in Warren, OH with 3.3%.
What is the Percentage of Hispanic or Latino Population in Warren, OH?
Percentage of Hispanic or Latino Population in Warren is 3.7%.
What is the Percentage of Hispanic or Latino Population in Ohio?
Percentage of Hispanic or Latino Population in Ohio is 4.2%.
What is the Percentage of Hispanic or Latino Population in the United States?
Percentage of Hispanic or Latino Population in the United States is 18.7%.