Zip Codes with the Highest Percentage of Population Employed in Arts, Entertainment & Recreation in Steubenville, OH
RELATED REPORTS & OPTIONS
Arts, Entertainment & Recreation
Steubenville
Compare Zip Codes
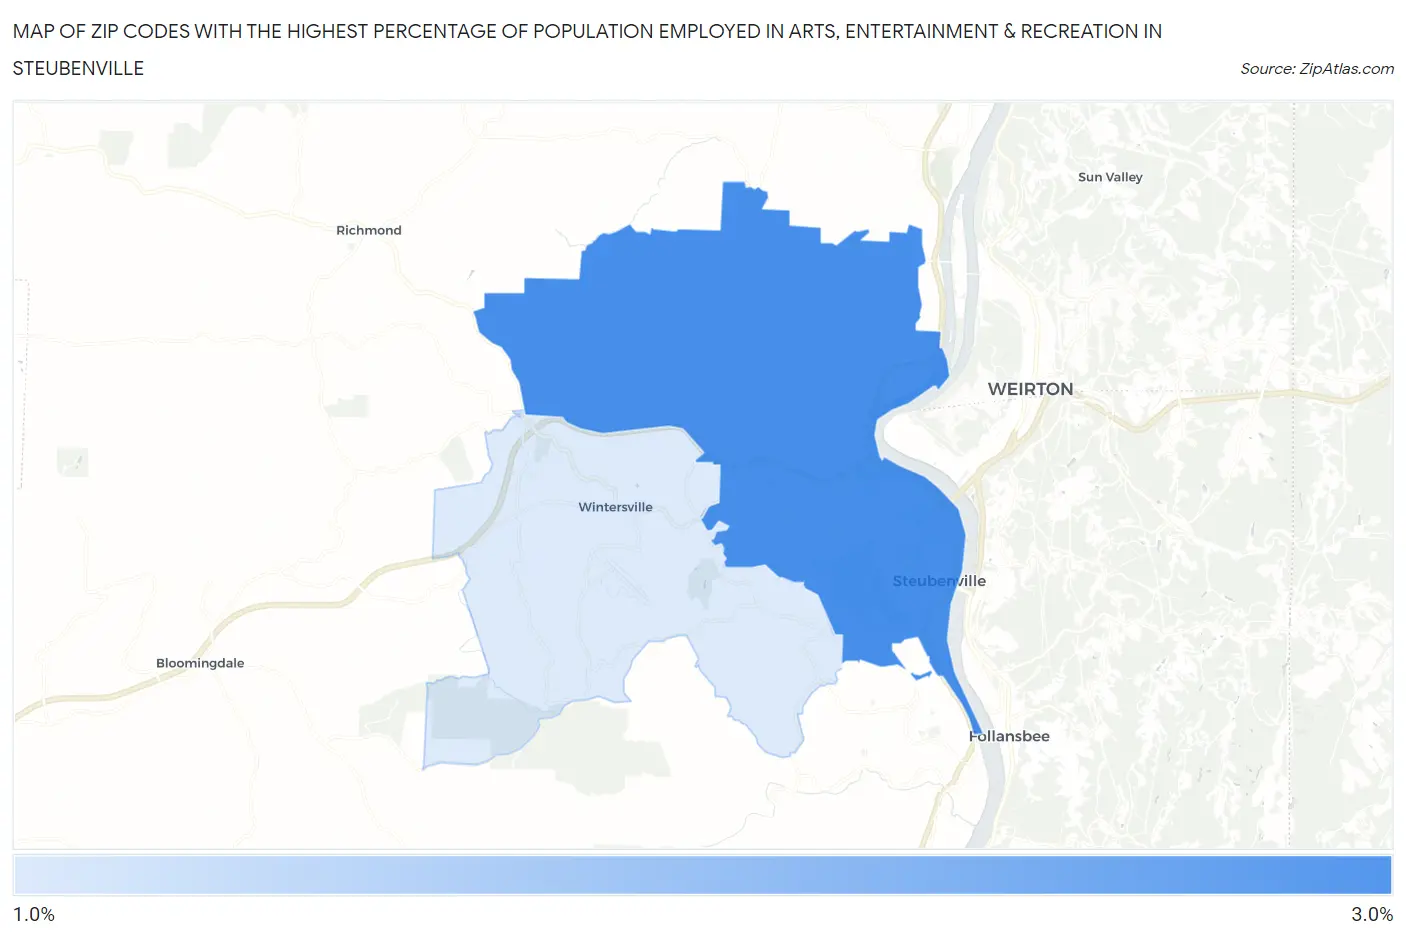
Map of Zip Codes with the Highest Percentage of Population Employed in Arts, Entertainment & Recreation in Steubenville
0.0%
3.0%
Zip Codes with the Highest Percentage of Population Employed in Arts, Entertainment & Recreation in Steubenville, OH
| Zip Code | % Employed | vs State | vs National | |
| 1. | 43952 | 2.7% | 1.7%(+1.04)#131 | 2.1%(+0.634)#6,298 |
| 2. | 43953 | 1.7% | 1.7%(+0.056)#333 | 2.1%(-0.348)#11,488 |
1
Common Questions
What are the Top Zip Codes with the Highest Percentage of Population Employed in Arts, Entertainment & Recreation in Steubenville, OH?
Top Zip Codes with the Highest Percentage of Population Employed in Arts, Entertainment & Recreation in Steubenville, OH are:
What zip code has the Highest Percentage of Population Employed in Arts, Entertainment & Recreation in Steubenville, OH?
43952 has the Highest Percentage of Population Employed in Arts, Entertainment & Recreation in Steubenville, OH with 2.7%.
What is the Percentage of Population Employed in Arts, Entertainment & Recreation in Steubenville, OH?
Percentage of Population Employed in Arts, Entertainment & Recreation in Steubenville is 3.0%.
What is the Percentage of Population Employed in Arts, Entertainment & Recreation in Ohio?
Percentage of Population Employed in Arts, Entertainment & Recreation in Ohio is 1.7%.
What is the Percentage of Population Employed in Arts, Entertainment & Recreation in the United States?
Percentage of Population Employed in Arts, Entertainment & Recreation in the United States is 2.1%.