Zip Codes with the Highest Percentage of Population Walking to Work in Massillon, OH
RELATED REPORTS & OPTIONS
Walk to Work
Massillon
Compare Zip Codes
Map of Zip Codes with the Highest Percentage of Population Walking to Work in Massillon
36.9%
37.0%
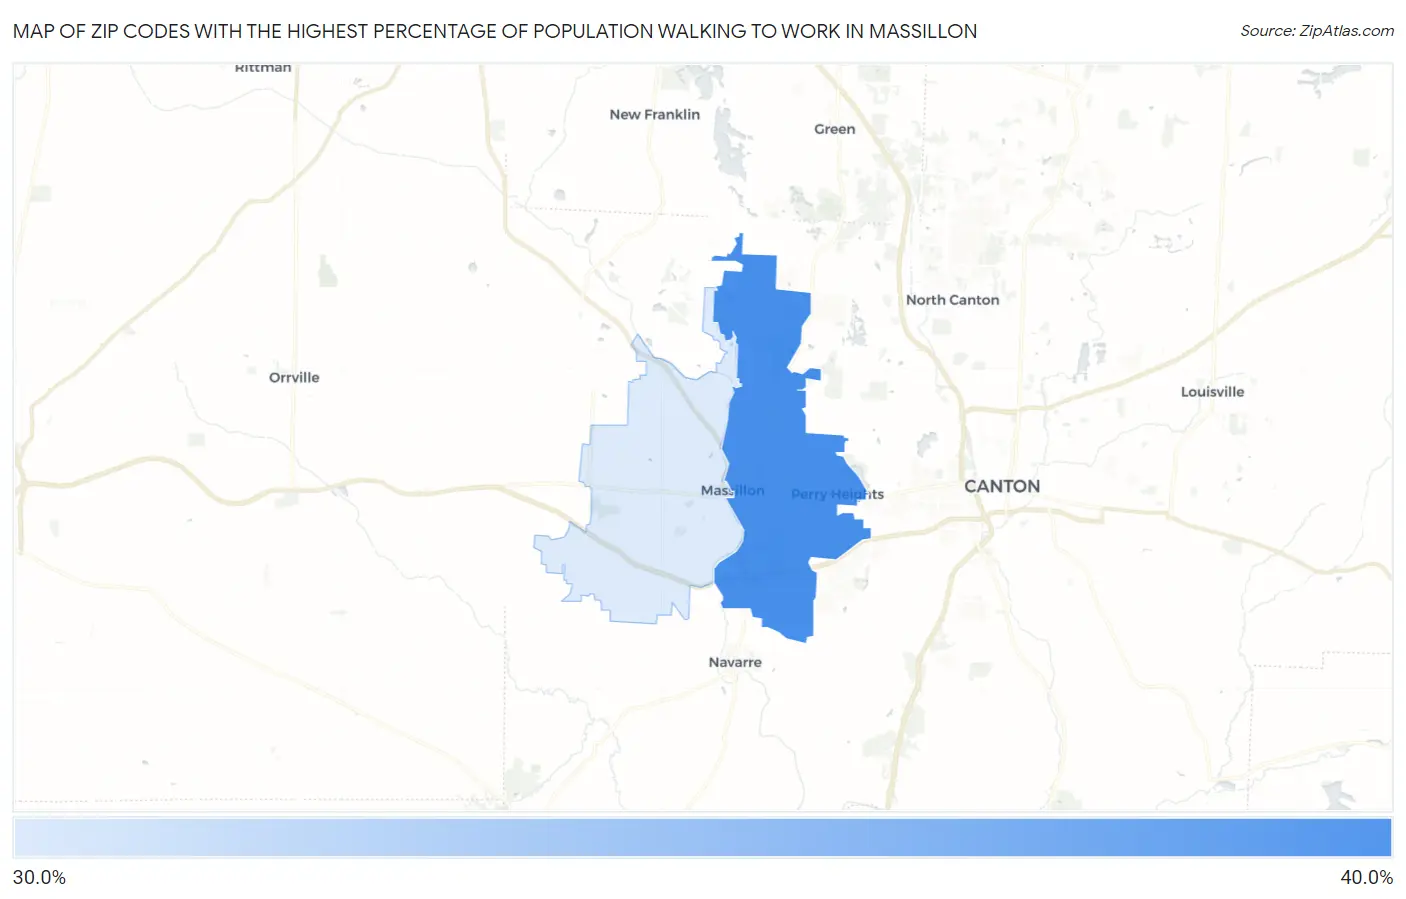
Zip Codes with the Highest Percentage of Population Walking to Work in Massillon, OH
| Zip Code | % Walk to Work | vs State | vs National | |
| 1. | 44646 | 37.0% | 30.0%(+7.00)#325 | 33.4%(+3.60)#9,661 |
| 2. | 44647 | 36.9% | 30.0%(+6.90)#329 | 33.4%(+3.50)#9,711 |
1
Common Questions
What are the Top Zip Codes with the Highest Percentage of Population Walking to Work in Massillon, OH?
Top Zip Codes with the Highest Percentage of Population Walking to Work in Massillon, OH are:
What zip code has the Highest Percentage of Population Walking to Work in Massillon, OH?
44646 has the Highest Percentage of Population Walking to Work in Massillon, OH with 37.0%.
What is the Percentage of Population Walking to Work in Massillon, OH?
Percentage of Population Walking to Work in Massillon is 34.9%.
What is the Percentage of Population Walking to Work in Ohio?
Percentage of Population Walking to Work in Ohio is 30.0%.
What is the Percentage of Population Walking to Work in the United States?
Percentage of Population Walking to Work in the United States is 33.4%.