Zip Codes with the Highest Percentage of Population Employed in Farming, Fishing & Forestry in Dayton, OH

RELATED REPORTS & OPTIONS

Farming, Fishing & Forestry
Population
Families and Households
Female Fertility
Female Fertility (Unmarried)
Race (Community Size)
Race (Percentage)
Ancestry (Community Size)
AfricanAlbanianAlsatianAmericanApacheArabArgentineanArmenianAustralianAustrianBasqueBelgianBhutaneseBlackfeetBolivianBrazilianBritishBulgarianBurmeseCajunCanadianCape VerdeanCelticCentral AmericanCentral American IndianCherokeeChileanChippewaChoctawColombianCosta RicanCreekCroatianCubanCzechCzechoslovakianDanishDominicanDutchEastern EuropeanEcuadorianEgyptianEnglishEstonianEthiopianEuropeanFilipinoFinnishFrenchFrench CanadianGermanGhanaianGreekGuamanian / ChamorroGuatemalanHaitianHonduranHungarianIcelanderIndian (Asian)InupiatIranianIraqiIrishIroquoisItalianJamaicanJapaneseKenyanKoreanLaotianLatvianLebaneseLiberianLithuanianLuxembourgerMacedonianMalteseMexicanMexican American IndianMoroccanNative HawaiianNavajoNicaraguanNigerianNorthern EuropeanNorwegianOkinawanPakistaniPalestinianPanamanianPennsylvania GermanPeruvianPolishPortuguesePotawatomiPuerto RicanRomanianRussianSalvadoranSamoanScandinavianScotch-IrishScottishSeminoleSenegaleseSerbianSiouxSlavicSlovakSloveneSouth AfricanSouth AmericanSpaniardSpanishSri LankanSubsaharan AfricanSudaneseSwedishSwissSyrianThaiTrinidadian and TobagonianTurkishUkrainianVenezuelanWelshWest IndianYugoslavian
Ancestry (Percentage)
AfricanAlbanianAlsatianAmericanApacheArabArgentineanArmenianAustralianAustrianBasqueBelgianBhutaneseBlackfeetBolivianBrazilianBritishBulgarianBurmeseCajunCanadianCape VerdeanCelticCentral AmericanCentral American IndianCherokeeChileanChippewaChoctawColombianCosta RicanCreekCroatianCubanCzechCzechoslovakianDanishDominicanDutchEastern EuropeanEcuadorianEgyptianEnglishEstonianEthiopianEuropeanFilipinoFinnishFrenchFrench CanadianGermanGhanaianGreekGuamanian / ChamorroGuatemalanHaitianHonduranHungarianIcelanderIndian (Asian)InupiatIranianIraqiIrishIroquoisItalianJamaicanJapaneseKenyanKoreanLaotianLatvianLebaneseLiberianLithuanianLuxembourgerMacedonianMalteseMexicanMexican American IndianMoroccanNative HawaiianNavajoNicaraguanNigerianNorthern EuropeanNorwegianOkinawanPakistaniPalestinianPanamanianPennsylvania GermanPeruvianPolishPortuguesePotawatomiPuerto RicanRomanianRussianSalvadoranSamoanScandinavianScotch-IrishScottishSeminoleSenegaleseSerbianSiouxSlavicSlovakSloveneSouth AfricanSouth AmericanSpaniardSpanishSri LankanSubsaharan AfricanSudaneseSwedishSwissSyrianThaiTrinidadian and TobagonianTurkishUkrainianVenezuelanWelshWest IndianYugoslavian
Immigrant Origin (Total)
AfricaArgentinaAsiaAustraliaBelarusBosnia and HerzegovinaBrazilBulgariaCambodiaCameroonCanadaCaribbeanCentral AmericaChinaColombiaCongoCosta RicaCubaDominican RepublicEastern AfricaEastern AsiaEastern EuropeEcuadorEgyptEl SalvadorEnglandEthiopiaEuropeFranceGermanyGhanaGreeceGuatemalaGuyanaHaitiHondurasHong KongHungaryIndiaIndonesiaIranIraqIrelandIsraelItalyJamaicaJapanJordanKenyaKoreaKuwaitLatin AmericaLebanonLiberiaMalaysiaMexicoMiddle AfricaMoldovaMoroccoNetherlandsNigeriaNorthern AfricaNorthern EuropeNorwayOceaniaPakistanPanamaPeruPhilippinesPolandPortugalRomaniaRussiaSaudi ArabiaScotlandSenegalSingaporeSouth AfricaSouth AmericaSouth Central AsiaSouth Eastern AsiaSouthern EuropeSpainSudanTaiwanThailandTrinidad and TobagoTurkeyUkraineUzbekistanVenezuelaVietnamWestern AfricaWestern AsiaWestern EuropeZaire
Immigrant Origin (Percentage)
AfricaArgentinaAsiaAustraliaBelarusBosnia and HerzegovinaBrazilBulgariaCambodiaCameroonCanadaCaribbeanCentral AmericaChinaColombiaCongoCosta RicaCubaDominican RepublicEastern AfricaEastern AsiaEastern EuropeEcuadorEgyptEl SalvadorEnglandEthiopiaEuropeFranceGermanyGhanaGreeceGuatemalaGuyanaHaitiHondurasHong KongHungaryIndiaIndonesiaIranIraqIrelandIsraelItalyJamaicaJapanJordanKenyaKoreaKuwaitLatin AmericaLebanonLiberiaMalaysiaMexicoMiddle AfricaMoldovaMoroccoNetherlandsNigeriaNorthern AfricaNorthern EuropeNorwayOceaniaPakistanPanamaPeruPhilippinesPolandPortugalRomaniaRussiaSaudi ArabiaScotlandSenegalSingaporeSouth AfricaSouth AmericaSouth Central AsiaSouth Eastern AsiaSouthern EuropeSpainSudanTaiwanThailandTrinidad and TobagoTurkeyUkraineUzbekistanVenezuelaVietnamWestern AfricaWestern AsiaWestern EuropeZaire
Income
Income (Families)
Income (Households)
Poverty
Poverty (Families)
Unemployment
Employment Occupations
Employment Industries
Employer Class
Commute Time
Commute Means
School Enrollment
Education by Degree Field
Occupancy
Finances
Physical Characteristics
Dayton
Compare Zip Codes
Comparison Subject

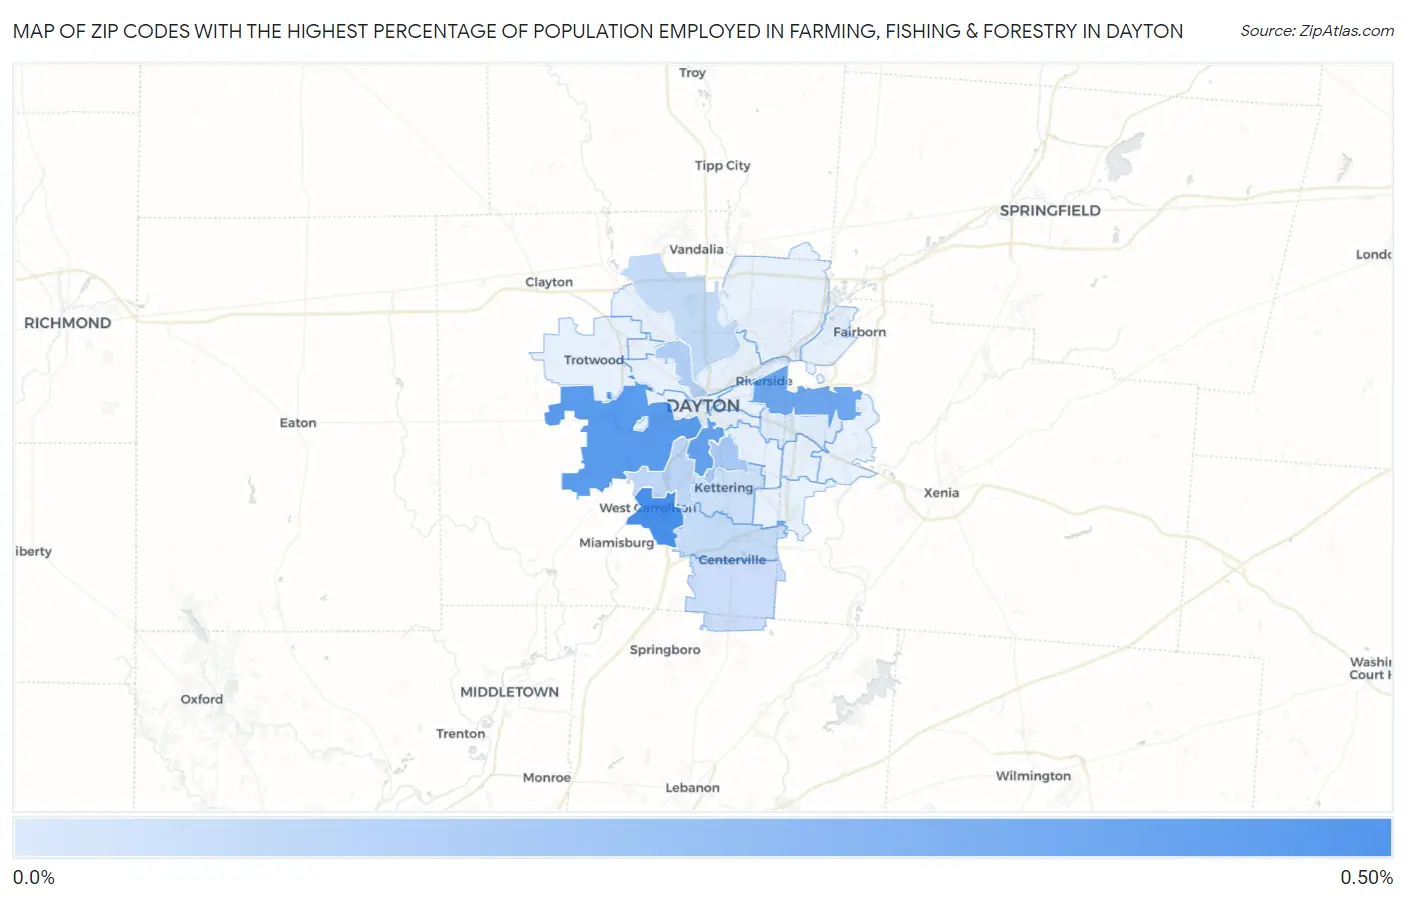
Map of Zip Codes with the Highest Percentage of Population Employed in Farming, Fishing & Forestry in Dayton

0.0%
0.50%
Zip Codes with the Highest Percentage of Population Employed in Farming, Fishing & Forestry in Dayton Map

Zip Codes with the Highest Percentage of Population Employed in Farming, Fishing & Forestry in Dayton, OH

Zip Code % Employed vs State vs National
1.454490.47%0.29%(+0.181)#2990.61%(-0.136)#13,110
2.454170.42%0.29%(+0.132)#3190.61%(-0.184)#13,580
3.454090.38%0.29%(+0.093)#3310.61%(-0.224)#13,928
4.454310.35%0.29%(+0.060)#3430.61%(-0.257)#14,286
5.454190.18%0.29%(-0.105)#4390.61%(-0.422)#16,375
6.454050.14%0.29%(-0.144)#4620.61%(-0.461)#17,014
7.454390.11%0.29%(-0.179)#4850.61%(-0.496)#17,584
8.454140.087%0.29%(-0.202)#5050.61%(-0.519)#17,989
9.454590.083%0.29%(-0.206)#5100.61%(-0.523)#18,062
10.454580.066%0.29%(-0.222)#5260.61%(-0.539)#18,359
11.454290.060%0.29%(-0.229)#5340.61%(-0.546)#18,480
12.454320.013%0.29%(-0.275)#5660.61%(-0.592)#19,129

Common Questions

What are the Top 10 Zip Codes with the Highest Percentage of Population Employed in Farming, Fishing & Forestry in Dayton, OH?
Top 10 Zip Codes with the Highest Percentage of Population Employed in Farming, Fishing & Forestry in Dayton, OH are:
#1
0.47%
#2
0.42%
#3
0.38%
#4
0.35%
#5
0.18%
#6
0.14%
#7
0.11%
#8
0.087%
#9
0.083%
#10
0.066%
What zip code has the Highest Percentage of Population Employed in Farming, Fishing & Forestry in Dayton, OH?
45449 has the Highest Percentage of Population Employed in Farming, Fishing & Forestry in Dayton, OH with 0.47%.
What is the Percentage of Population Employed in Farming, Fishing & Forestry in Dayton, OH?
Percentage of Population Employed in Farming, Fishing & Forestry in Dayton is 0.039%.
What is the Percentage of Population Employed in Farming, Fishing & Forestry in Ohio?
Percentage of Population Employed in Farming, Fishing & Forestry in Ohio is 0.29%.
What is the Percentage of Population Employed in Farming, Fishing & Forestry in the United States?
Percentage of Population Employed in Farming, Fishing & Forestry in the United States is 0.61%.