Zip Codes with the Highest Percentage of Population Employed in Sales & Related in Columbus, OH

RELATED REPORTS & OPTIONS

Sales & Related
Population
Families and Households
Female Fertility
Female Fertility (Unmarried)
Race (Community Size)
Race (Percentage)
Ancestry (Community Size)
AfghanAfricanAlbanianAlsatianAmericanApacheArabArgentineanArmenianAustralianAustrianBahamianBangladeshiBarbadianBasqueBelgianBelizeanBhutaneseBlackfeetBolivianBrazilianBritishBritish West IndianBulgarianBurmeseCambodianCanadianCape VerdeanCarpatho RusynCelticCentral AmericanCentral American IndianCherokeeChileanChippewaChoctawColombianCosta RicanCreeCreekCroatianCrowCubanCzechCzechoslovakianDanishDelawareDominicanDutchDutch West IndianEastern EuropeanEcuadorianEgyptianEnglishEstonianEthiopianEuropeanFilipinoFinnishFrenchFrench American IndianFrench CanadianGermanGerman RussianGhanaianGreekGuamanian / ChamorroGuatemalanGuyaneseHaitianHonduranHungarianIcelanderIndian (Asian)IndonesianInupiatIranianIraqiIrishIroquoisIsraeliItalianJamaicanJapaneseJordanianKenyanKoreanLaotianLatvianLebaneseLiberianLithuanianLumbeeLuxembourgerMacedonianMalaysianMalteseMexicanMexican American IndianMongolianMoroccanNative HawaiianNavajoNew ZealanderNicaraguanNigerianNorthern EuropeanNorwegianPakistaniPalestinianPanamanianParaguayanPennsylvania GermanPeruvianPolishPortuguesePuerto RicanRomanianRussianSalvadoranSamoanScandinavianScotch-IrishScottishSeminoleSenegaleseSerbianSierra LeoneanSiouxSlavicSlovakSloveneSomaliSouth AfricanSouth AmericanSouth American IndianSpaniardSpanishSri LankanSubsaharan AfricanSudaneseSwedishSwissSyrianThaiTrinidadian and TobagonianTurkishUgandanUkrainianUruguayanVenezuelanVietnameseWelshWest IndianYaquiYugoslavianZimbabwean
Ancestry (Percentage)
AfghanAfricanAlbanianAlsatianAmericanApacheArabArgentineanArmenianAustralianAustrianBahamianBangladeshiBarbadianBasqueBelgianBelizeanBhutaneseBlackfeetBolivianBrazilianBritishBritish West IndianBulgarianBurmeseCambodianCanadianCape VerdeanCarpatho RusynCelticCentral AmericanCentral American IndianCherokeeChileanChippewaChoctawColombianCosta RicanCreeCreekCroatianCrowCubanCzechCzechoslovakianDanishDelawareDominicanDutchDutch West IndianEastern EuropeanEcuadorianEgyptianEnglishEstonianEthiopianEuropeanFilipinoFinnishFrenchFrench American IndianFrench CanadianGermanGerman RussianGhanaianGreekGuamanian / ChamorroGuatemalanGuyaneseHaitianHonduranHungarianIcelanderIndian (Asian)IndonesianInupiatIranianIraqiIrishIroquoisIsraeliItalianJamaicanJapaneseJordanianKenyanKoreanLaotianLatvianLebaneseLiberianLithuanianLumbeeLuxembourgerMacedonianMalaysianMalteseMexicanMexican American IndianMongolianMoroccanNative HawaiianNavajoNew ZealanderNicaraguanNigerianNorthern EuropeanNorwegianPakistaniPalestinianPanamanianParaguayanPennsylvania GermanPeruvianPolishPortuguesePuerto RicanRomanianRussianSalvadoranSamoanScandinavianScotch-IrishScottishSeminoleSenegaleseSerbianSierra LeoneanSiouxSlavicSlovakSloveneSomaliSouth AfricanSouth AmericanSouth American IndianSpaniardSpanishSri LankanSubsaharan AfricanSudaneseSwedishSwissSyrianThaiTrinidadian and TobagonianTurkishUgandanUkrainianUruguayanVenezuelanVietnameseWelshWest IndianYaquiYugoslavianZimbabwean
Immigrant Origin (Total)
AfghanistanAfricaAlbaniaArgentinaArmeniaAsiaAustraliaBahamasBangladeshBarbadosBelarusBelgiumBelizeBosnia and HerzegovinaBrazilBulgariaBurma / MyanmarCambodiaCameroonCanadaCaribbeanCentral AmericaChileChinaColombiaCongoCosta RicaCubaCzechoslovakiaDominican RepublicEastern AfricaEastern AsiaEastern EuropeEcuadorEgyptEl SalvadorEnglandEritreaEthiopiaEuropeFranceGermanyGhanaGreeceGuatemalaGuyanaHaitiHondurasHong KongHungaryIndiaIndonesiaIranIraqIrelandIsraelItalyJamaicaJapanJordanKazakhstanKenyaKoreaKuwaitLaosLatin AmericaLatviaLebanonLiberiaLithuaniaMalaysiaMexicoMiddle AfricaMoroccoNepalNetherlandsNigeriaNorth MacedoniaNorthern AfricaNorthern EuropeOceaniaPakistanPanamaPeruPhilippinesPolandRomaniaRussiaSaudi ArabiaScotlandSenegalSerbiaSierra LeoneSingaporeSomaliaSouth AfricaSouth AmericaSouth Central AsiaSouth Eastern AsiaSouthern EuropeSpainSri LankaSudanSwitzerlandSyriaTaiwanThailandTrinidad and TobagoTurkeyUgandaUkraineUruguayUzbekistanVenezuelaVietnamWestern AfricaWestern AsiaWestern EuropeZaireZimbabwe
Immigrant Origin (Percentage)
AfghanistanAfricaAlbaniaArgentinaArmeniaAsiaAustraliaBahamasBangladeshBarbadosBelarusBelgiumBelizeBosnia and HerzegovinaBrazilBulgariaBurma / MyanmarCambodiaCameroonCanadaCaribbeanCentral AmericaChileChinaColombiaCongoCosta RicaCubaCzechoslovakiaDominican RepublicEastern AfricaEastern AsiaEastern EuropeEcuadorEgyptEl SalvadorEnglandEritreaEthiopiaEuropeFranceGermanyGhanaGreeceGuatemalaGuyanaHaitiHondurasHong KongHungaryIndiaIndonesiaIranIraqIrelandIsraelItalyJamaicaJapanJordanKazakhstanKenyaKoreaKuwaitLaosLatin AmericaLatviaLebanonLiberiaLithuaniaMalaysiaMexicoMiddle AfricaMoroccoNepalNetherlandsNigeriaNorth MacedoniaNorthern AfricaNorthern EuropeOceaniaPakistanPanamaPeruPhilippinesPolandRomaniaRussiaSaudi ArabiaScotlandSenegalSerbiaSierra LeoneSingaporeSomaliaSouth AfricaSouth AmericaSouth Central AsiaSouth Eastern AsiaSouthern EuropeSpainSri LankaSudanSwitzerlandSyriaTaiwanThailandTrinidad and TobagoTurkeyUgandaUkraineUruguayUzbekistanVenezuelaVietnamWestern AfricaWestern AsiaWestern EuropeZaireZimbabwe
Income
Income (Families)
Income (Households)
Poverty
Poverty (Families)
Unemployment
Employment Occupations
Employment Industries
Employer Class
Commute Time
Commute Means
School Enrollment
Education by Degree Field
Occupancy
Finances
Physical Characteristics
Columbus
Compare Zip Codes
Comparison Subject

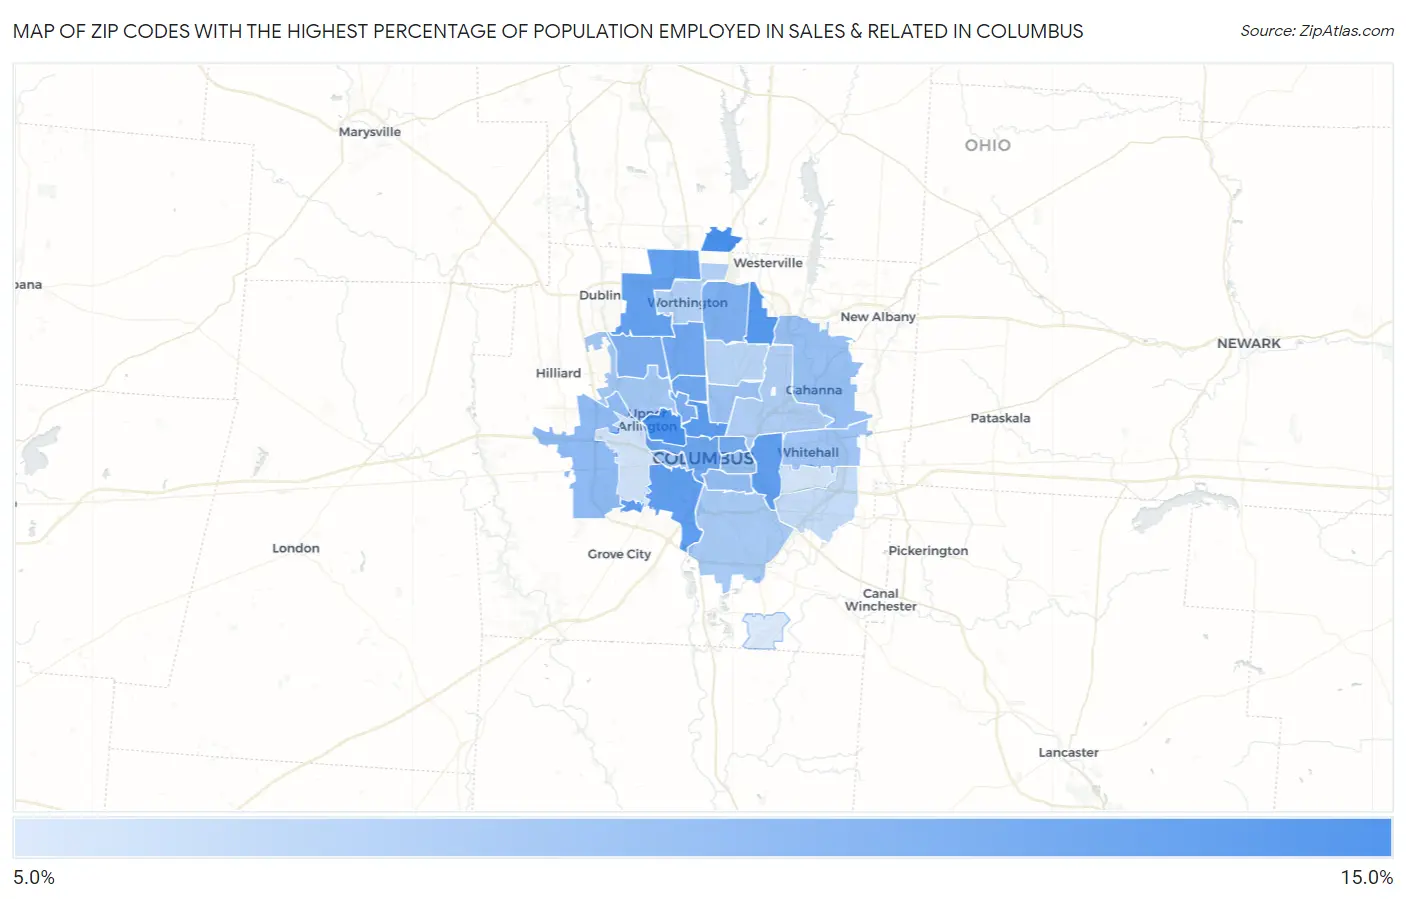
Map of Zip Codes with the Highest Percentage of Population Employed in Sales & Related in Columbus

0.0%
15.0%
Zip Codes with the Highest Percentage of Population Employed in Sales & Related in Columbus Map

Zip Codes with the Highest Percentage of Population Employed in Sales & Related in Columbus, OH

Zip Code % Employed vs State vs National
1.4324012.0%9.1%(+2.83)#1619.6%(+2.38)#6,091
2.4321211.9%9.1%(+2.76)#1669.6%(+2.31)#6,218
3.4323111.4%9.1%(+2.24)#2039.6%(+1.79)#7,286
4.4320111.2%9.1%(+2.05)#2209.6%(+1.59)#7,724
5.4320911.0%9.1%(+1.84)#2349.6%(+1.39)#8,243
6.4322311.0%9.1%(+1.84)#2359.6%(+1.39)#8,247
7.4323510.9%9.1%(+1.71)#2469.6%(+1.26)#8,573
8.4321510.4%9.1%(+1.27)#2939.6%(+0.822)#9,748
9.4321410.3%9.1%(+1.20)#2999.6%(+0.743)#10,006
10.4320210.3%9.1%(+1.17)#3059.6%(+0.722)#10,052
11.4320310.1%9.1%(+0.986)#3219.6%(+0.533)#10,626
12.432109.9%9.1%(+0.788)#3479.6%(+0.336)#11,229
13.432299.8%9.1%(+0.660)#3629.6%(+0.208)#11,637
14.432209.8%9.1%(+0.639)#3709.6%(+0.186)#11,744
15.432289.1%9.1%(-0.019)#4789.6%(-0.472)#14,062
16.432069.0%9.1%(-0.155)#5009.6%(-0.607)#14,550
17.432058.9%9.1%(-0.262)#5129.6%(-0.715)#14,960
18.432308.8%9.1%(-0.340)#5239.6%(-0.792)#15,258
19.432228.7%9.1%(-0.461)#5439.6%(-0.914)#15,701
20.432118.6%9.1%(-0.532)#5499.6%(-0.984)#15,939
21.432138.4%9.1%(-0.736)#5709.6%(-1.19)#16,676
22.432218.3%9.1%(-0.865)#5849.6%(-1.32)#17,142
23.432078.1%9.1%(-1.03)#6099.6%(-1.48)#17,681
24.432197.8%9.1%(-1.29)#6469.6%(-1.75)#18,519
25.430857.6%9.1%(-1.50)#6789.6%(-1.95)#19,185
26.432247.4%9.1%(-1.73)#7099.6%(-2.18)#19,932
27.432327.0%9.1%(-2.13)#7609.6%(-2.58)#21,133
28.432046.5%9.1%(-2.61)#7979.6%(-3.06)#22,351
29.432276.4%9.1%(-2.75)#8059.6%(-3.20)#22,719
30.432176.1%9.1%(-3.06)#8479.6%(-3.51)#23,466

Common Questions

What are the Top 10 Zip Codes with the Highest Percentage of Population Employed in Sales & Related in Columbus, OH?
Top 10 Zip Codes with the Highest Percentage of Population Employed in Sales & Related in Columbus, OH are:
#1
12.0%
#2
11.9%
#3
11.4%
#4
11.2%
#5
11.0%
#6
11.0%
#7
10.9%
#8
10.4%
#9
10.3%
#10
10.3%
What zip code has the Highest Percentage of Population Employed in Sales & Related in Columbus, OH?
43240 has the Highest Percentage of Population Employed in Sales & Related in Columbus, OH with 12.0%.
What is the Percentage of Population Employed in Sales & Related in Columbus, OH?
Percentage of Population Employed in Sales & Related in Columbus is 9.0%.
What is the Percentage of Population Employed in Sales & Related in Ohio?
Percentage of Population Employed in Sales & Related in Ohio is 9.1%.
What is the Percentage of Population Employed in Sales & Related in the United States?
Percentage of Population Employed in Sales & Related in the United States is 9.6%.