Zip Codes with the Highest Percentage of Self-Employed / Incorporated in Cleveland, OH

RELATED REPORTS & OPTIONS

Self-Employed / Incorporated
Population
Families and Households
Female Fertility
Female Fertility (Unmarried)
Race (Community Size)
Race (Percentage)
Ancestry (Community Size)
AfghanAfricanAlbanianAlsatianAmericanApacheArabArgentineanArmenianAustralianAustrianBahamianBangladeshiBarbadianBelgianBelizeanBhutaneseBlackfeetBrazilianBritishBritish West IndianBulgarianBurmeseCajunCambodianCanadianCape VerdeanCarpatho RusynCelticCentral AmericanCentral American IndianCherokeeChickasawChileanChippewaChoctawColombianComancheCosta RicanCreekCroatianCubanCzechCzechoslovakianDanishDelawareDominicanDutchDutch West IndianEastern EuropeanEcuadorianEgyptianEnglishEstonianEthiopianEuropeanFilipinoFinnishFrenchFrench American IndianFrench CanadianGermanGhanaianGreekGuamanian / ChamorroGuatemalanGuyaneseHaitianHonduranHungarianIcelanderIndian (Asian)IndonesianIranianIraqiIrishIroquoisIsraeliItalianJamaicanJapaneseJordanianKoreanLaotianLatvianLebaneseLiberianLithuanianLumbeeLuxembourgerMacedonianMalaysianMexicanMexican American IndianMongolianMoroccanNative HawaiianNavajoNicaraguanNigerianNorthern EuropeanNorwegianPakistaniPalestinianPanamanianParaguayanPennsylvania GermanPeruvianPolishPortuguesePuebloPuerto RicanRomanianRussianSalvadoranSamoanScandinavianScotch-IrishScottishSeminoleSerbianSierra LeoneanSiouxSlavicSlovakSloveneSomaliSouth AfricanSouth AmericanSouth American IndianSpaniardSpanishSri LankanSubsaharan AfricanSudaneseSwedishSwissSyrianThaiTrinidadian and TobagonianTurkishU.S. Virgin IslanderUgandanUkrainianUruguayanVenezuelanVietnameseWelshWest IndianYaquiYugoslavianZimbabwean
Ancestry (Percentage)
AfghanAfricanAlbanianAlsatianAmericanApacheArabArgentineanArmenianAustralianAustrianBahamianBangladeshiBarbadianBelgianBelizeanBhutaneseBlackfeetBrazilianBritishBritish West IndianBulgarianBurmeseCajunCambodianCanadianCape VerdeanCarpatho RusynCelticCentral AmericanCentral American IndianCherokeeChickasawChileanChippewaChoctawColombianComancheCosta RicanCreekCroatianCubanCzechCzechoslovakianDanishDelawareDominicanDutchDutch West IndianEastern EuropeanEcuadorianEgyptianEnglishEstonianEthiopianEuropeanFilipinoFinnishFrenchFrench American IndianFrench CanadianGermanGhanaianGreekGuamanian / ChamorroGuatemalanGuyaneseHaitianHonduranHungarianIcelanderIndian (Asian)IndonesianIranianIraqiIrishIroquoisIsraeliItalianJamaicanJapaneseJordanianKoreanLaotianLatvianLebaneseLiberianLithuanianLumbeeLuxembourgerMacedonianMalaysianMexicanMexican American IndianMongolianMoroccanNative HawaiianNavajoNicaraguanNigerianNorthern EuropeanNorwegianPakistaniPalestinianPanamanianParaguayanPennsylvania GermanPeruvianPolishPortuguesePuebloPuerto RicanRomanianRussianSalvadoranSamoanScandinavianScotch-IrishScottishSeminoleSerbianSierra LeoneanSiouxSlavicSlovakSloveneSomaliSouth AfricanSouth AmericanSouth American IndianSpaniardSpanishSri LankanSubsaharan AfricanSudaneseSwedishSwissSyrianThaiTrinidadian and TobagonianTurkishU.S. Virgin IslanderUgandanUkrainianUruguayanVenezuelanVietnameseWelshWest IndianYaquiYugoslavianZimbabwean
Immigrant Origin (Total)
AfghanistanAfricaAlbaniaArgentinaAsiaAustraliaAustriaBangladeshBarbadosBelarusBelgiumBelizeBosnia and HerzegovinaBrazilBulgariaBurma / MyanmarCambodiaCanadaCaribbeanCentral AmericaChileChinaColombiaCongoCosta RicaCroatiaCubaCzechoslovakiaDominican RepublicEastern AfricaEastern AsiaEastern EuropeEcuadorEgyptEl SalvadorEnglandEthiopiaEuropeFranceGermanyGhanaGreeceGuatemalaGuyanaHaitiHondurasHong KongHungaryIndiaIndonesiaIranIraqIrelandIsraelItalyJamaicaJapanJordanKazakhstanKenyaKoreaKuwaitLaosLatin AmericaLatviaLebanonLiberiaLithuaniaMalaysiaMexicoMiddle AfricaMoldovaMoroccoNepalNetherlandsNicaraguaNigeriaNorthern AfricaNorthern EuropeOceaniaPakistanPanamaPeruPhilippinesPolandRomaniaRussiaSaudi ArabiaScotlandSerbiaSierra LeoneSingaporeSomaliaSouth AfricaSouth AmericaSouth Central AsiaSouth Eastern AsiaSouthern EuropeSpainSri LankaSudanSwedenSyriaTaiwanThailandTrinidad and TobagoTurkeyUgandaUkraineUruguayUzbekistanVenezuelaVietnamWest IndiesWestern AfricaWestern AsiaWestern EuropeZaireZimbabwe
Immigrant Origin (Percentage)
AfghanistanAfricaAlbaniaArgentinaAsiaAustraliaAustriaBangladeshBarbadosBelarusBelgiumBelizeBosnia and HerzegovinaBrazilBulgariaBurma / MyanmarCambodiaCanadaCaribbeanCentral AmericaChileChinaColombiaCongoCosta RicaCroatiaCubaCzechoslovakiaDominican RepublicEastern AfricaEastern AsiaEastern EuropeEcuadorEgyptEl SalvadorEnglandEthiopiaEuropeFranceGermanyGhanaGreeceGuatemalaGuyanaHaitiHondurasHong KongHungaryIndiaIndonesiaIranIraqIrelandIsraelItalyJamaicaJapanJordanKazakhstanKenyaKoreaKuwaitLaosLatin AmericaLatviaLebanonLiberiaLithuaniaMalaysiaMexicoMiddle AfricaMoldovaMoroccoNepalNetherlandsNicaraguaNigeriaNorthern AfricaNorthern EuropeOceaniaPakistanPanamaPeruPhilippinesPolandRomaniaRussiaSaudi ArabiaScotlandSerbiaSierra LeoneSingaporeSomaliaSouth AfricaSouth AmericaSouth Central AsiaSouth Eastern AsiaSouthern EuropeSpainSri LankaSudanSwedenSyriaTaiwanThailandTrinidad and TobagoTurkeyUgandaUkraineUruguayUzbekistanVenezuelaVietnamWest IndiesWestern AfricaWestern AsiaWestern EuropeZaireZimbabwe
Income
Income (Families)
Income (Households)
Poverty
Poverty (Families)
Unemployment
Employment Occupations
Employment Industries
Employer Class
Commute Time
Commute Means
School Enrollment
Education by Degree Field
Occupancy
Finances
Physical Characteristics
Cleveland
Compare Zip Codes
Comparison Subject

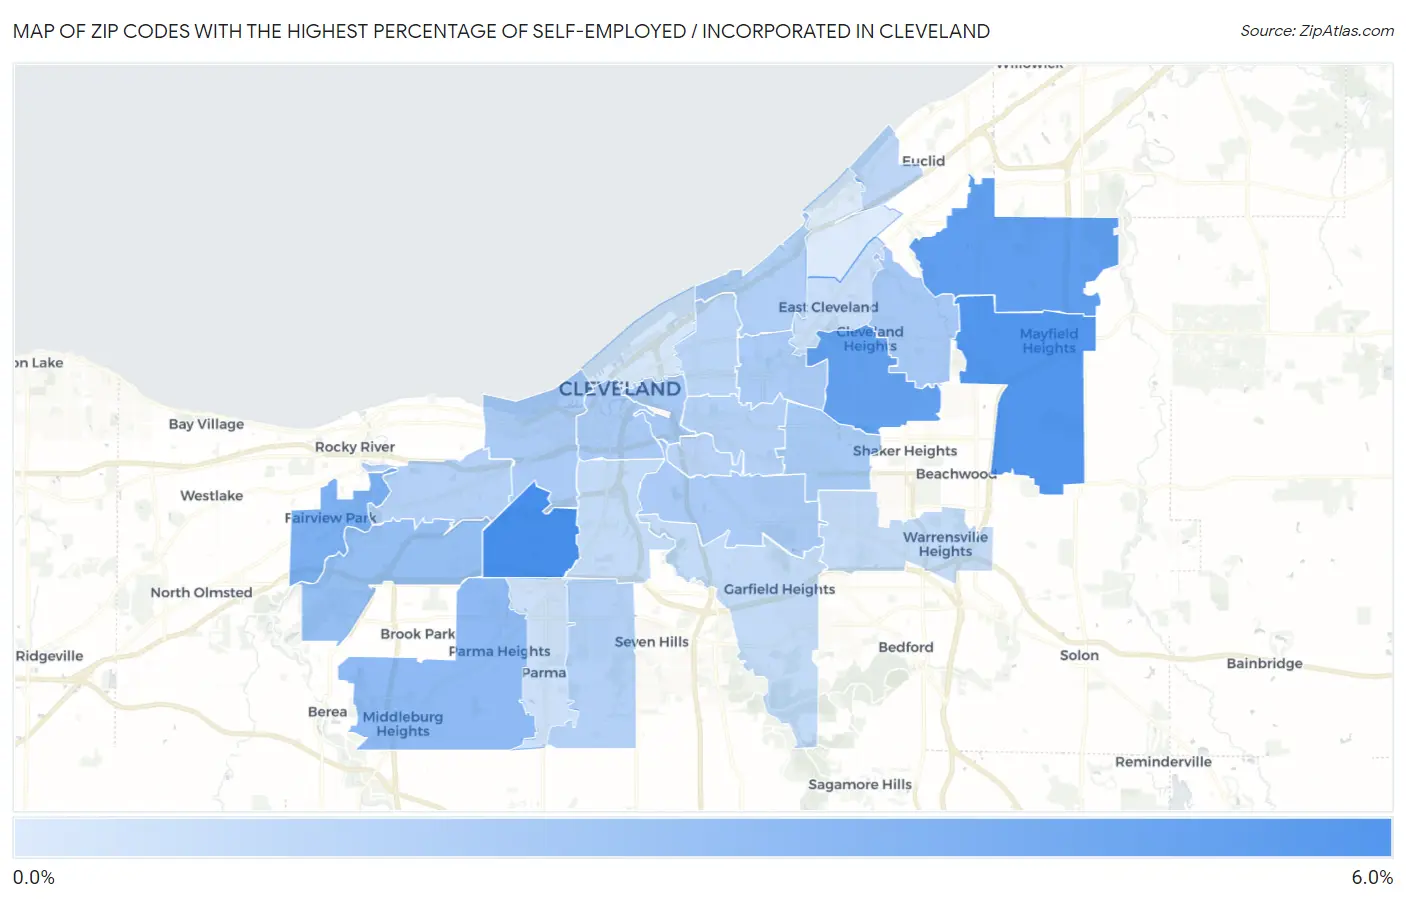
Map of Zip Codes with the Highest Percentage of Self-Employed / Incorporated in Cleveland

0.0%
6.0%
Zip Codes with the Highest Percentage of Self-Employed / Incorporated in Cleveland Map

Zip Codes with the Highest Percentage of Self-Employed / Incorporated in Cleveland, OH

Zip Code % Self-Employed / Incorporated vs State vs National
1.441445.8%3.0%(+2.75)#1293.8%(+1.96)#6,749
2.441245.4%3.0%(+2.35)#1523.8%(+1.56)#7,647
3.441434.9%3.0%(+1.91)#1793.8%(+1.12)#8,770
4.441184.8%3.0%(+1.81)#1873.8%(+1.02)#9,059
5.441264.1%3.0%(+1.04)#2633.8%(+0.248)#11,667
6.441303.5%3.0%(+0.423)#3473.8%(-0.365)#14,244
7.441353.2%3.0%(+0.213)#3923.8%(-0.576)#15,211
8.441212.7%3.0%(-0.313)#4893.8%(-1.10)#17,784
9.441152.7%3.0%(-0.348)#4993.8%(-1.14)#17,991
10.441202.6%3.0%(-0.393)#5093.8%(-1.18)#18,243
11.441052.6%3.0%(-0.473)#5273.8%(-1.26)#18,636
12.441062.5%3.0%(-0.495)#5343.8%(-1.28)#18,743
13.441132.5%3.0%(-0.516)#5403.8%(-1.30)#18,835
14.441022.5%3.0%(-0.521)#5423.8%(-1.31)#18,854
15.441082.3%3.0%(-0.707)#5773.8%(-1.50)#19,763
16.441342.3%3.0%(-0.773)#5883.8%(-1.56)#20,084
17.441042.2%3.0%(-0.782)#5903.8%(-1.57)#20,136
18.441112.2%3.0%(-0.797)#5933.8%(-1.59)#20,198
19.441272.1%3.0%(-0.941)#6363.8%(-1.73)#20,938
20.441032.0%3.0%(-1.00)#6503.8%(-1.79)#21,249
21.441191.9%3.0%(-1.09)#6713.8%(-1.88)#21,664
22.441251.8%3.0%(-1.27)#7093.8%(-2.06)#22,424
23.441281.7%3.0%(-1.33)#7253.8%(-2.12)#22,670
24.441091.7%3.0%(-1.33)#7273.8%(-2.12)#22,676
25.441121.6%3.0%(-1.44)#7483.8%(-2.23)#23,156
26.441291.4%3.0%(-1.62)#7923.8%(-2.41)#23,840
27.441141.1%3.0%(-1.91)#8563.8%(-2.70)#24,935
28.441100.92%3.0%(-2.10)#8923.8%(-2.89)#25,488

Common Questions

What are the Top 10 Zip Codes with the Highest Percentage of Self-Employed / Incorporated in Cleveland, OH?
Top 10 Zip Codes with the Highest Percentage of Self-Employed / Incorporated in Cleveland, OH are:
#1
5.8%
#2
5.4%
#3
4.9%
#4
4.8%
#5
4.1%
#6
3.5%
#7
3.2%
#8
2.7%
#9
2.7%
#10
2.6%
What zip code has the Highest Percentage of Self-Employed / Incorporated in Cleveland, OH?
44144 has the Highest Percentage of Self-Employed / Incorporated in Cleveland, OH with 5.8%.
What is the Percentage of Self-Employed / Incorporated in Cleveland, OH?
Percentage of Self-Employed / Incorporated in Cleveland is 2.3%.
What is the Percentage of Self-Employed / Incorporated in Ohio?
Percentage of Self-Employed / Incorporated in Ohio is 3.0%.
What is the Percentage of Self-Employed / Incorporated in the United States?
Percentage of Self-Employed / Incorporated in the United States is 3.8%.