Zip Codes with the Highest Percentage of Population Employed in Sales & Related in Cleveland, OH

RELATED REPORTS & OPTIONS

Sales & Related
Population
Families and Households
Female Fertility
Female Fertility (Unmarried)
Race (Community Size)
Race (Percentage)
Ancestry (Community Size)
AfghanAfricanAlbanianAlsatianAmericanApacheArabArgentineanArmenianAustralianAustrianBahamianBangladeshiBarbadianBelgianBelizeanBhutaneseBlackfeetBrazilianBritishBritish West IndianBulgarianBurmeseCajunCambodianCanadianCape VerdeanCarpatho RusynCelticCentral AmericanCentral American IndianCherokeeChickasawChileanChippewaChoctawColombianComancheCosta RicanCreekCroatianCubanCzechCzechoslovakianDanishDelawareDominicanDutchDutch West IndianEastern EuropeanEcuadorianEgyptianEnglishEstonianEthiopianEuropeanFilipinoFinnishFrenchFrench American IndianFrench CanadianGermanGhanaianGreekGuamanian / ChamorroGuatemalanGuyaneseHaitianHonduranHungarianIcelanderIndian (Asian)IndonesianIranianIraqiIrishIroquoisIsraeliItalianJamaicanJapaneseJordanianKoreanLaotianLatvianLebaneseLiberianLithuanianLumbeeLuxembourgerMacedonianMalaysianMexicanMexican American IndianMongolianMoroccanNative HawaiianNavajoNicaraguanNigerianNorthern EuropeanNorwegianPakistaniPalestinianPanamanianParaguayanPennsylvania GermanPeruvianPolishPortuguesePuebloPuerto RicanRomanianRussianSalvadoranSamoanScandinavianScotch-IrishScottishSeminoleSerbianSierra LeoneanSiouxSlavicSlovakSloveneSomaliSouth AfricanSouth AmericanSouth American IndianSpaniardSpanishSri LankanSubsaharan AfricanSudaneseSwedishSwissSyrianThaiTrinidadian and TobagonianTurkishU.S. Virgin IslanderUgandanUkrainianUruguayanVenezuelanVietnameseWelshWest IndianYaquiYugoslavianZimbabwean
Ancestry (Percentage)
AfghanAfricanAlbanianAlsatianAmericanApacheArabArgentineanArmenianAustralianAustrianBahamianBangladeshiBarbadianBelgianBelizeanBhutaneseBlackfeetBrazilianBritishBritish West IndianBulgarianBurmeseCajunCambodianCanadianCape VerdeanCarpatho RusynCelticCentral AmericanCentral American IndianCherokeeChickasawChileanChippewaChoctawColombianComancheCosta RicanCreekCroatianCubanCzechCzechoslovakianDanishDelawareDominicanDutchDutch West IndianEastern EuropeanEcuadorianEgyptianEnglishEstonianEthiopianEuropeanFilipinoFinnishFrenchFrench American IndianFrench CanadianGermanGhanaianGreekGuamanian / ChamorroGuatemalanGuyaneseHaitianHonduranHungarianIcelanderIndian (Asian)IndonesianIranianIraqiIrishIroquoisIsraeliItalianJamaicanJapaneseJordanianKoreanLaotianLatvianLebaneseLiberianLithuanianLumbeeLuxembourgerMacedonianMalaysianMexicanMexican American IndianMongolianMoroccanNative HawaiianNavajoNicaraguanNigerianNorthern EuropeanNorwegianPakistaniPalestinianPanamanianParaguayanPennsylvania GermanPeruvianPolishPortuguesePuebloPuerto RicanRomanianRussianSalvadoranSamoanScandinavianScotch-IrishScottishSeminoleSerbianSierra LeoneanSiouxSlavicSlovakSloveneSomaliSouth AfricanSouth AmericanSouth American IndianSpaniardSpanishSri LankanSubsaharan AfricanSudaneseSwedishSwissSyrianThaiTrinidadian and TobagonianTurkishU.S. Virgin IslanderUgandanUkrainianUruguayanVenezuelanVietnameseWelshWest IndianYaquiYugoslavianZimbabwean
Immigrant Origin (Total)
AfghanistanAfricaAlbaniaArgentinaAsiaAustraliaAustriaBangladeshBarbadosBelarusBelgiumBelizeBosnia and HerzegovinaBrazilBulgariaBurma / MyanmarCambodiaCanadaCaribbeanCentral AmericaChileChinaColombiaCongoCosta RicaCroatiaCubaCzechoslovakiaDominican RepublicEastern AfricaEastern AsiaEastern EuropeEcuadorEgyptEl SalvadorEnglandEthiopiaEuropeFranceGermanyGhanaGreeceGuatemalaGuyanaHaitiHondurasHong KongHungaryIndiaIndonesiaIranIraqIrelandIsraelItalyJamaicaJapanJordanKazakhstanKenyaKoreaKuwaitLaosLatin AmericaLatviaLebanonLiberiaLithuaniaMalaysiaMexicoMiddle AfricaMoldovaMoroccoNepalNetherlandsNicaraguaNigeriaNorthern AfricaNorthern EuropeOceaniaPakistanPanamaPeruPhilippinesPolandRomaniaRussiaSaudi ArabiaScotlandSerbiaSierra LeoneSingaporeSomaliaSouth AfricaSouth AmericaSouth Central AsiaSouth Eastern AsiaSouthern EuropeSpainSri LankaSudanSwedenSyriaTaiwanThailandTrinidad and TobagoTurkeyUgandaUkraineUruguayUzbekistanVenezuelaVietnamWest IndiesWestern AfricaWestern AsiaWestern EuropeZaireZimbabwe
Immigrant Origin (Percentage)
AfghanistanAfricaAlbaniaArgentinaAsiaAustraliaAustriaBangladeshBarbadosBelarusBelgiumBelizeBosnia and HerzegovinaBrazilBulgariaBurma / MyanmarCambodiaCanadaCaribbeanCentral AmericaChileChinaColombiaCongoCosta RicaCroatiaCubaCzechoslovakiaDominican RepublicEastern AfricaEastern AsiaEastern EuropeEcuadorEgyptEl SalvadorEnglandEthiopiaEuropeFranceGermanyGhanaGreeceGuatemalaGuyanaHaitiHondurasHong KongHungaryIndiaIndonesiaIranIraqIrelandIsraelItalyJamaicaJapanJordanKazakhstanKenyaKoreaKuwaitLaosLatin AmericaLatviaLebanonLiberiaLithuaniaMalaysiaMexicoMiddle AfricaMoldovaMoroccoNepalNetherlandsNicaraguaNigeriaNorthern AfricaNorthern EuropeOceaniaPakistanPanamaPeruPhilippinesPolandRomaniaRussiaSaudi ArabiaScotlandSerbiaSierra LeoneSingaporeSomaliaSouth AfricaSouth AmericaSouth Central AsiaSouth Eastern AsiaSouthern EuropeSpainSri LankaSudanSwedenSyriaTaiwanThailandTrinidad and TobagoTurkeyUgandaUkraineUruguayUzbekistanVenezuelaVietnamWest IndiesWestern AfricaWestern AsiaWestern EuropeZaireZimbabwe
Income
Income (Families)
Income (Households)
Poverty
Poverty (Families)
Unemployment
Employment Occupations
Employment Industries
Employer Class
Commute Time
Commute Means
School Enrollment
Education by Degree Field
Occupancy
Finances
Physical Characteristics
Cleveland
Compare Zip Codes
Comparison Subject

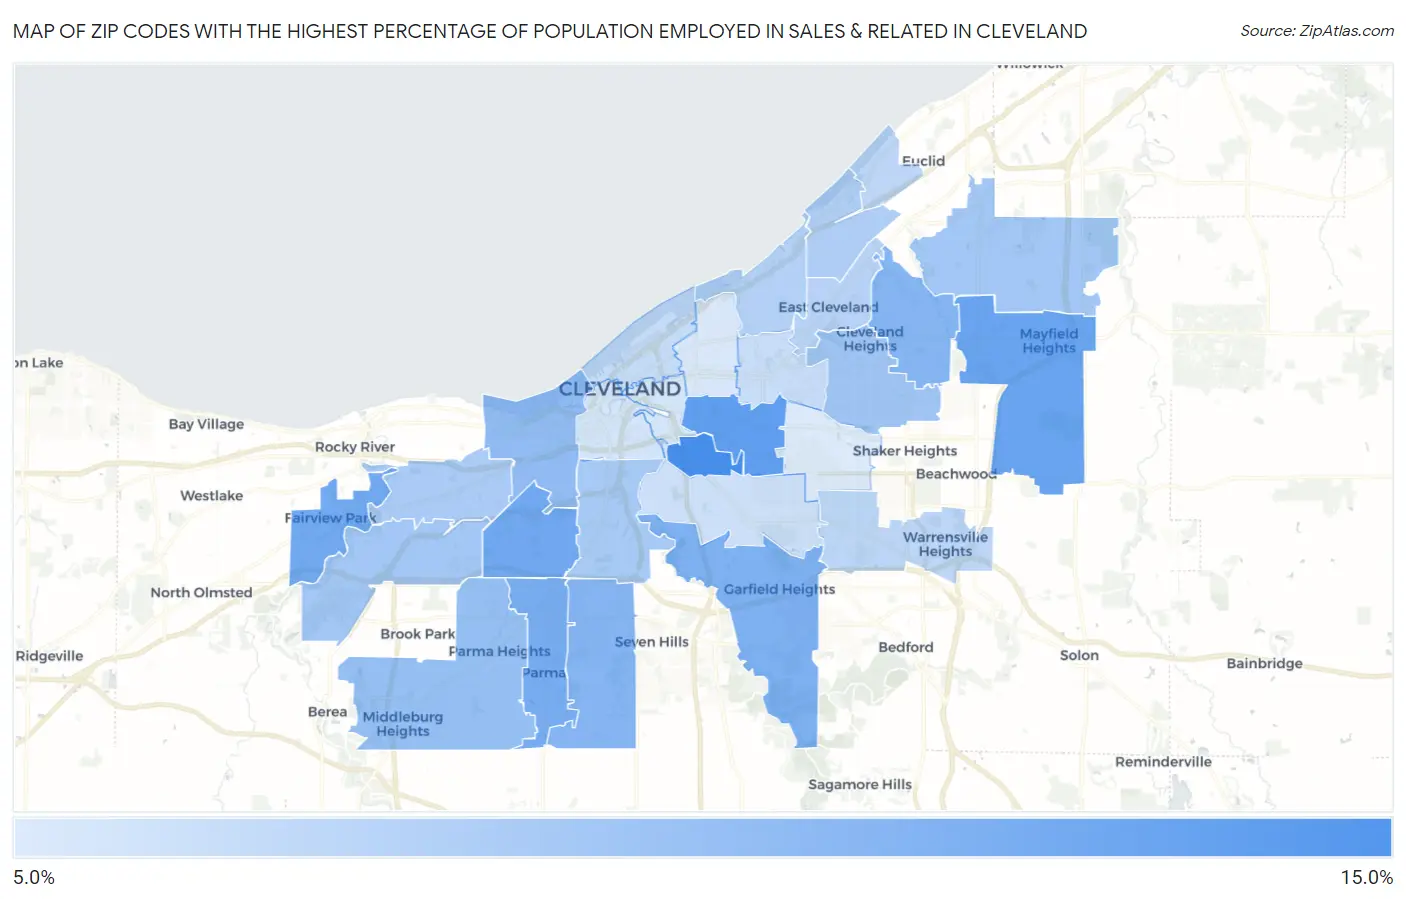
Map of Zip Codes with the Highest Percentage of Population Employed in Sales & Related in Cleveland

0.0%
15.0%
Zip Codes with the Highest Percentage of Population Employed in Sales & Related in Cleveland Map

Zip Codes with the Highest Percentage of Population Employed in Sales & Related in Cleveland, OH

Zip Code % Employed vs State vs National
1.4412713.7%9.1%(+4.52)#969.6%(+4.07)#3,784
2.4410412.2%9.1%(+3.11)#1439.6%(+2.65)#5,579
3.4412411.8%9.1%(+2.64)#1719.6%(+2.19)#6,434
4.4414411.4%9.1%(+2.27)#1989.6%(+1.82)#7,225
5.4412611.2%9.1%(+2.09)#2179.6%(+1.64)#7,632
6.4412911.0%9.1%(+1.86)#2329.6%(+1.41)#8,186
7.4412510.7%9.1%(+1.51)#2689.6%(+1.06)#9,117
8.4413410.3%9.1%(+1.12)#3119.6%(+0.668)#10,216
9.4412110.2%9.1%(+1.05)#3169.6%(+0.595)#10,455
10.441029.5%9.1%(+0.403)#4119.6%(-0.050)#12,574
11.441309.3%9.1%(+0.183)#4449.6%(-0.270)#13,343
12.441188.7%9.1%(-0.456)#5419.6%(-0.908)#15,686
13.441358.6%9.1%(-0.501)#5479.6%(-0.954)#15,838
14.441438.5%9.1%(-0.594)#5589.6%(-1.05)#16,172
15.441098.3%9.1%(-0.849)#5839.6%(-1.30)#17,085
16.441118.3%9.1%(-0.890)#5939.6%(-1.34)#17,234
17.441108.0%9.1%(-1.18)#6279.6%(-1.64)#18,178
18.441087.7%9.1%(-1.40)#6629.6%(-1.86)#18,862
19.441127.5%9.1%(-1.60)#6879.6%(-2.06)#19,535
20.441197.3%9.1%(-1.84)#7239.6%(-2.30)#20,298
21.441287.3%9.1%(-1.86)#7279.6%(-2.31)#20,353
22.441146.8%9.1%(-2.38)#7819.6%(-2.83)#21,805
23.441066.6%9.1%(-2.52)#7899.6%(-2.98)#22,132
24.441056.4%9.1%(-2.77)#8149.6%(-3.22)#22,780
25.441136.1%9.1%(-3.06)#8449.6%(-3.51)#23,457
26.441155.9%9.1%(-3.21)#8619.6%(-3.67)#23,807
27.441035.8%9.1%(-3.31)#8719.6%(-3.77)#24,010
28.441205.5%9.1%(-3.59)#9009.6%(-4.05)#24,583

Common Questions

What are the Top 10 Zip Codes with the Highest Percentage of Population Employed in Sales & Related in Cleveland, OH?
Top 10 Zip Codes with the Highest Percentage of Population Employed in Sales & Related in Cleveland, OH are:
#1
13.7%
#2
12.2%
#3
11.8%
#4
11.4%
#5
11.2%
#6
11.0%
#7
10.7%
#8
10.3%
#9
10.2%
#10
9.5%
What zip code has the Highest Percentage of Population Employed in Sales & Related in Cleveland, OH?
44127 has the Highest Percentage of Population Employed in Sales & Related in Cleveland, OH with 13.7%.
What is the Percentage of Population Employed in Sales & Related in Cleveland, OH?
Percentage of Population Employed in Sales & Related in Cleveland is 8.2%.
What is the Percentage of Population Employed in Sales & Related in Ohio?
Percentage of Population Employed in Sales & Related in Ohio is 9.1%.
What is the Percentage of Population Employed in Sales & Related in the United States?
Percentage of Population Employed in Sales & Related in the United States is 9.6%.