Zip Codes with the Highest Percentage of Population Employed in Sales & Related in Cincinnati, OH
RELATED REPORTS & OPTIONS
Sales & Related
Cincinnati
Compare Zip Codes
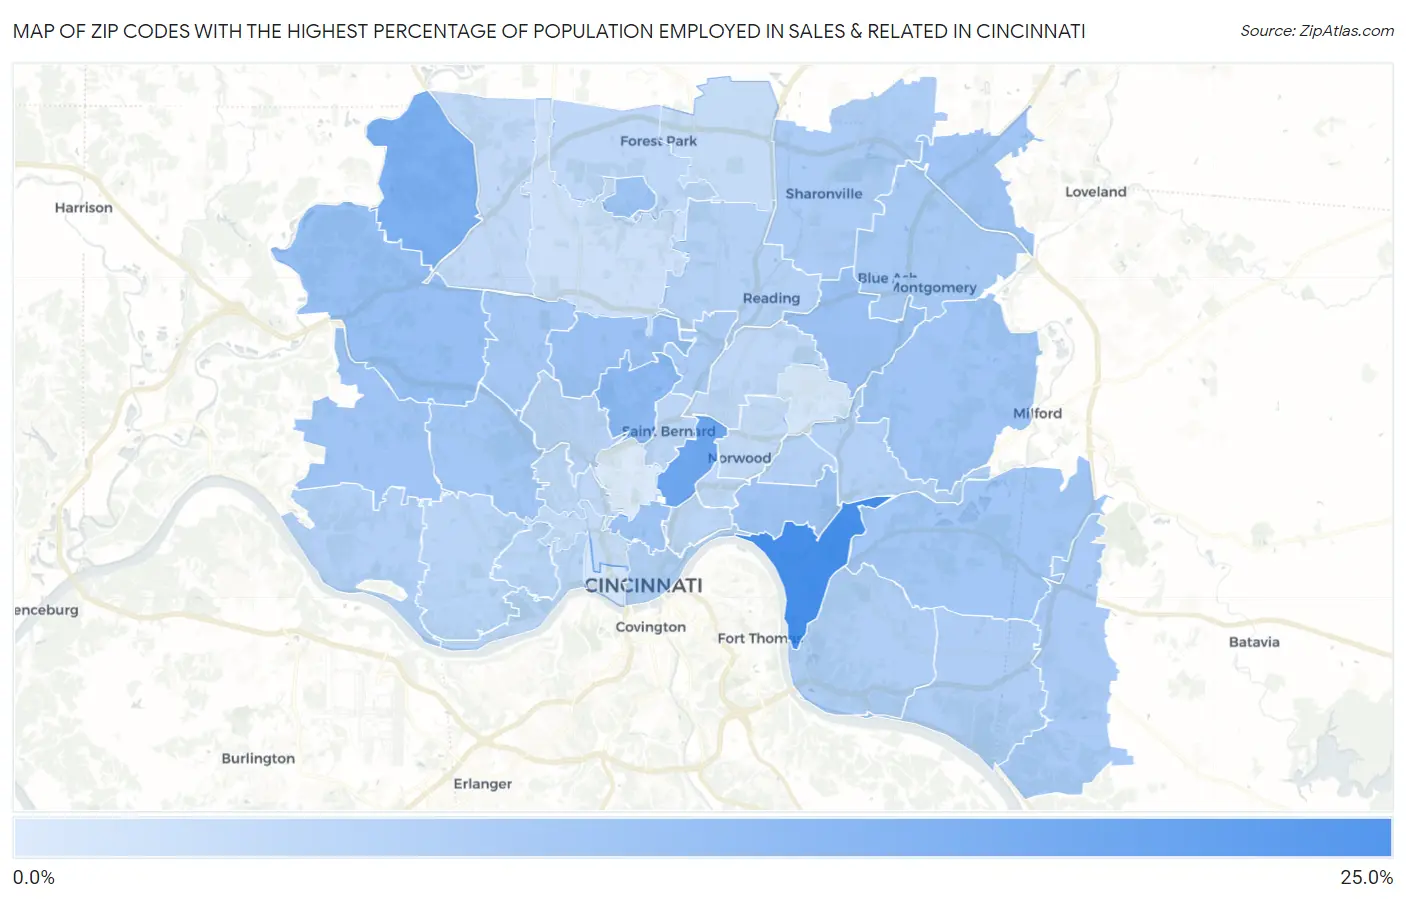
Map of Zip Codes with the Highest Percentage of Population Employed in Sales & Related in Cincinnati
4.5%
21.9%
Zip Codes with the Highest Percentage of Population Employed in Sales & Related in Cincinnati, OH
| Zip Code | % Employed | vs State | vs National | |
| 1. | 45226 | 21.9% | 9.1%(+12.8)#26 | 9.6%(+12.3)#905 |
| 2. | 45229 | 17.2% | 9.1%(+8.05)#52 | 9.6%(+7.60)#1,775 |
| 3. | 45252 | 15.4% | 9.1%(+6.24)#68 | 9.6%(+5.78)#2,542 |
| 4. | 45232 | 13.4% | 9.1%(+4.22)#102 | 9.6%(+3.77)#4,079 |
| 5. | 45247 | 12.1% | 9.1%(+2.98)#149 | 9.6%(+2.53)#5,812 |
| 6. | 45236 | 11.9% | 9.1%(+2.79)#165 | 9.6%(+2.33)#6,173 |
| 7. | 45224 | 11.6% | 9.1%(+2.46)#180 | 9.6%(+2.01)#6,789 |
| 8. | 45218 | 11.5% | 9.1%(+2.36)#190 | 9.6%(+1.90)#7,015 |
| 9. | 45208 | 11.3% | 9.1%(+2.11)#214 | 9.6%(+1.66)#7,582 |
| 10. | 45249 | 11.2% | 9.1%(+2.09)#218 | 9.6%(+1.64)#7,634 |
| 11. | 45248 | 11.2% | 9.1%(+2.02)#221 | 9.6%(+1.56)#7,795 |
| 12. | 45243 | 11.1% | 9.1%(+1.96)#227 | 9.6%(+1.50)#7,965 |
| 13. | 45219 | 11.0% | 9.1%(+1.87)#230 | 9.6%(+1.42)#8,157 |
| 14. | 45211 | 11.0% | 9.1%(+1.83)#238 | 9.6%(+1.38)#8,282 |
| 15. | 45244 | 10.9% | 9.1%(+1.72)#244 | 9.6%(+1.27)#8,532 |
| 16. | 45239 | 10.7% | 9.1%(+1.56)#260 | 9.6%(+1.11)#8,989 |
| 17. | 45242 | 10.4% | 9.1%(+1.29)#289 | 9.6%(+0.842)#9,693 |
| 18. | 45245 | 10.2% | 9.1%(+1.06)#315 | 9.6%(+0.605)#10,425 |
| 19. | 45216 | 9.9% | 9.1%(+0.739)#353 | 9.6%(+0.287)#11,390 |
| 20. | 45241 | 9.8% | 9.1%(+0.678)#358 | 9.6%(+0.226)#11,571 |
| 21. | 45255 | 9.6% | 9.1%(+0.408)#408 | 9.6%(-0.044)#12,556 |
| 22. | 45202 | 9.3% | 9.1%(+0.170)#449 | 9.6%(-0.282)#13,379 |
| 23. | 45230 | 9.3% | 9.1%(+0.112)#460 | 9.6%(-0.340)#13,580 |
| 24. | 45233 | 8.9% | 9.1%(-0.199)#503 | 9.6%(-0.652)#14,729 |
| 25. | 45227 | 8.9% | 9.1%(-0.211)#505 | 9.6%(-0.663)#14,769 |
| 26. | 45215 | 8.9% | 9.1%(-0.271)#514 | 9.6%(-0.723)#14,987 |
| 27. | 45209 | 8.8% | 9.1%(-0.330)#520 | 9.6%(-0.783)#15,214 |
| 28. | 45223 | 8.6% | 9.1%(-0.584)#554 | 9.6%(-1.04)#16,134 |
| 29. | 45205 | 8.4% | 9.1%(-0.774)#573 | 9.6%(-1.23)#16,789 |
| 30. | 45238 | 8.2% | 9.1%(-0.919)#598 | 9.6%(-1.37)#17,323 |
| 31. | 45204 | 8.2% | 9.1%(-0.941)#600 | 9.6%(-1.39)#17,401 |
| 32. | 45206 | 8.0% | 9.1%(-1.13)#619 | 9.6%(-1.59)#18,019 |
| 33. | 45217 | 7.9% | 9.1%(-1.24)#635 | 9.6%(-1.70)#18,354 |
| 34. | 45225 | 7.8% | 9.1%(-1.31)#647 | 9.6%(-1.76)#18,563 |
| 35. | 45237 | 7.8% | 9.1%(-1.31)#648 | 9.6%(-1.76)#18,568 |
| 36. | 45207 | 7.8% | 9.1%(-1.37)#659 | 9.6%(-1.82)#18,755 |
| 37. | 45240 | 7.7% | 9.1%(-1.41)#665 | 9.6%(-1.87)#18,896 |
| 38. | 45251 | 7.6% | 9.1%(-1.57)#682 | 9.6%(-2.02)#19,431 |
| 39. | 45212 | 7.3% | 9.1%(-1.89)#735 | 9.6%(-2.34)#20,467 |
| 40. | 45214 | 7.1% | 9.1%(-2.07)#752 | 9.6%(-2.52)#20,971 |
| 41. | 45246 | 7.0% | 9.1%(-2.13)#761 | 9.6%(-2.58)#21,135 |
| 42. | 45231 | 6.1% | 9.1%(-3.00)#835 | 9.6%(-3.45)#23,337 |
| 43. | 45203 | 5.3% | 9.1%(-3.86)#923 | 9.6%(-4.31)#25,079 |
| 44. | 45213 | 5.2% | 9.1%(-3.90)#928 | 9.6%(-4.35)#25,162 |
| 45. | 45220 | 4.5% | 9.1%(-4.66)#977 | 9.6%(-5.11)#26,358 |
1
Common Questions
What are the Top 10 Zip Codes with the Highest Percentage of Population Employed in Sales & Related in Cincinnati, OH?
Top 10 Zip Codes with the Highest Percentage of Population Employed in Sales & Related in Cincinnati, OH are:
What zip code has the Highest Percentage of Population Employed in Sales & Related in Cincinnati, OH?
45226 has the Highest Percentage of Population Employed in Sales & Related in Cincinnati, OH with 21.9%.
What is the Percentage of Population Employed in Sales & Related in Cincinnati, OH?
Percentage of Population Employed in Sales & Related in Cincinnati is 9.4%.
What is the Percentage of Population Employed in Sales & Related in Ohio?
Percentage of Population Employed in Sales & Related in Ohio is 9.1%.
What is the Percentage of Population Employed in Sales & Related in the United States?
Percentage of Population Employed in Sales & Related in the United States is 9.6%.