Zip Codes with the Highest Percentage of Population Employed in Construction & Extraction in Cincinnati, OH
RELATED REPORTS & OPTIONS
Construction & Extraction
Cincinnati
Compare Zip Codes
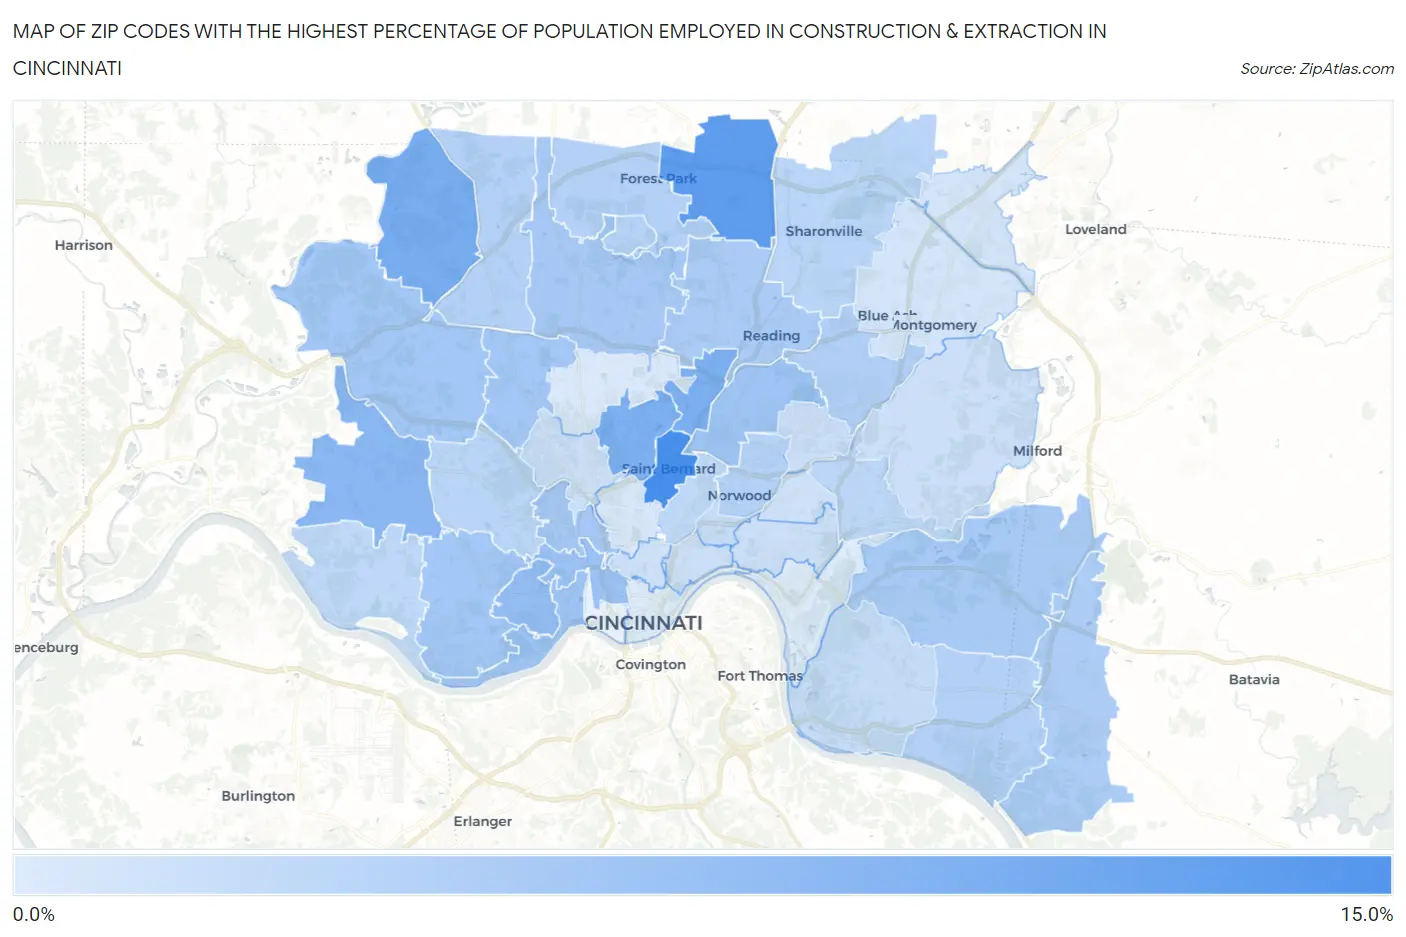
Map of Zip Codes with the Highest Percentage of Population Employed in Construction & Extraction in Cincinnati
0.46%
10.1%
Zip Codes with the Highest Percentage of Population Employed in Construction & Extraction in Cincinnati, OH
| Zip Code | % Employed | vs State | vs National | |
| 1. | 45217 | 10.1% | 4.1%(+5.94)#154 | 5.0%(+5.06)#5,336 |
| 2. | 45246 | 8.6% | 4.1%(+4.48)#220 | 5.0%(+3.59)#7,444 |
| 3. | 45252 | 6.9% | 4.1%(+2.81)#324 | 5.0%(+1.92)#10,944 |
| 4. | 45216 | 6.5% | 4.1%(+2.42)#357 | 5.0%(+1.54)#11,946 |
| 5. | 45232 | 6.3% | 4.1%(+2.24)#371 | 5.0%(+1.35)#12,464 |
| 6. | 45248 | 5.6% | 4.1%(+1.52)#452 | 5.0%(+0.634)#14,620 |
| 7. | 45205 | 5.0% | 4.1%(+0.901)#540 | 5.0%(+0.016)#16,713 |
| 8. | 45214 | 4.6% | 4.1%(+0.508)#597 | 5.0%(-0.376)#18,068 |
| 9. | 45204 | 4.4% | 4.1%(+0.289)#634 | 5.0%(-0.596)#18,882 |
| 10. | 45237 | 4.3% | 4.1%(+0.182)#648 | 5.0%(-0.703)#19,257 |
| 11. | 45247 | 4.1% | 4.1%(-0.010)#684 | 5.0%(-0.895)#19,939 |
| 12. | 45238 | 4.1% | 4.1%(-0.045)#690 | 5.0%(-0.930)#20,101 |
| 13. | 45239 | 4.1% | 4.1%(-0.052)#693 | 5.0%(-0.937)#20,121 |
| 14. | 45231 | 3.9% | 4.1%(-0.179)#715 | 5.0%(-1.06)#20,593 |
| 15. | 45225 | 3.9% | 4.1%(-0.191)#719 | 5.0%(-1.08)#20,638 |
| 16. | 45244 | 3.7% | 4.1%(-0.402)#752 | 5.0%(-1.29)#21,330 |
| 17. | 45215 | 3.5% | 4.1%(-0.563)#776 | 5.0%(-1.45)#21,854 |
| 18. | 45245 | 3.5% | 4.1%(-0.651)#787 | 5.0%(-1.54)#22,134 |
| 19. | 45236 | 3.2% | 4.1%(-0.883)#817 | 5.0%(-1.77)#22,872 |
| 20. | 45240 | 3.0% | 4.1%(-1.06)#844 | 5.0%(-1.94)#23,446 |
| 21. | 45255 | 3.0% | 4.1%(-1.08)#848 | 5.0%(-1.97)#23,522 |
| 22. | 45251 | 3.0% | 4.1%(-1.15)#852 | 5.0%(-2.03)#23,701 |
| 23. | 45218 | 2.9% | 4.1%(-1.21)#857 | 5.0%(-2.09)#23,867 |
| 24. | 45212 | 2.8% | 4.1%(-1.26)#868 | 5.0%(-2.15)#24,049 |
| 25. | 45241 | 2.6% | 4.1%(-1.51)#904 | 5.0%(-2.40)#24,782 |
| 26. | 45211 | 2.5% | 4.1%(-1.57)#912 | 5.0%(-2.46)#24,952 |
| 27. | 45227 | 2.5% | 4.1%(-1.62)#917 | 5.0%(-2.51)#25,082 |
| 28. | 45229 | 2.4% | 4.1%(-1.74)#932 | 5.0%(-2.62)#25,373 |
| 29. | 45233 | 2.3% | 4.1%(-1.78)#935 | 5.0%(-2.66)#25,478 |
| 30. | 45207 | 1.9% | 4.1%(-2.22)#994 | 5.0%(-3.11)#26,605 |
| 31. | 45230 | 1.9% | 4.1%(-2.24)#996 | 5.0%(-3.12)#26,633 |
| 32. | 45213 | 1.5% | 4.1%(-2.59)#1,026 | 5.0%(-3.47)#27,389 |
| 33. | 45206 | 1.5% | 4.1%(-2.60)#1,027 | 5.0%(-3.48)#27,409 |
| 34. | 45243 | 1.4% | 4.1%(-2.68)#1,033 | 5.0%(-3.56)#27,562 |
| 35. | 45208 | 1.4% | 4.1%(-2.68)#1,034 | 5.0%(-3.56)#27,567 |
| 36. | 45223 | 1.4% | 4.1%(-2.71)#1,036 | 5.0%(-3.59)#27,617 |
| 37. | 45219 | 1.3% | 4.1%(-2.81)#1,045 | 5.0%(-3.69)#27,828 |
| 38. | 45209 | 1.2% | 4.1%(-2.87)#1,049 | 5.0%(-3.75)#27,926 |
| 39. | 45249 | 1.0% | 4.1%(-3.08)#1,067 | 5.0%(-3.96)#28,272 |
| 40. | 45242 | 1.00% | 4.1%(-3.11)#1,070 | 5.0%(-4.00)#28,317 |
| 41. | 45220 | 0.68% | 4.1%(-3.42)#1,084 | 5.0%(-4.31)#28,747 |
| 42. | 45224 | 0.57% | 4.1%(-3.54)#1,090 | 5.0%(-4.42)#28,848 |
| 43. | 45226 | 0.48% | 4.1%(-3.63)#1,091 | 5.0%(-4.51)#28,936 |
| 44. | 45202 | 0.46% | 4.1%(-3.65)#1,093 | 5.0%(-4.54)#28,953 |
1
Common Questions
What are the Top 10 Zip Codes with the Highest Percentage of Population Employed in Construction & Extraction in Cincinnati, OH?
Top 10 Zip Codes with the Highest Percentage of Population Employed in Construction & Extraction in Cincinnati, OH are:
What zip code has the Highest Percentage of Population Employed in Construction & Extraction in Cincinnati, OH?
45217 has the Highest Percentage of Population Employed in Construction & Extraction in Cincinnati, OH with 10.1%.
What is the Percentage of Population Employed in Construction & Extraction in Cincinnati, OH?
Percentage of Population Employed in Construction & Extraction in Cincinnati is 2.3%.
What is the Percentage of Population Employed in Construction & Extraction in Ohio?
Percentage of Population Employed in Construction & Extraction in Ohio is 4.1%.
What is the Percentage of Population Employed in Construction & Extraction in the United States?
Percentage of Population Employed in Construction & Extraction in the United States is 5.0%.