Zip Codes with the Highest Percentage of Population Employed in Sales & Related in Akron, OH
RELATED REPORTS & OPTIONS
Sales & Related
Akron
Compare Zip Codes
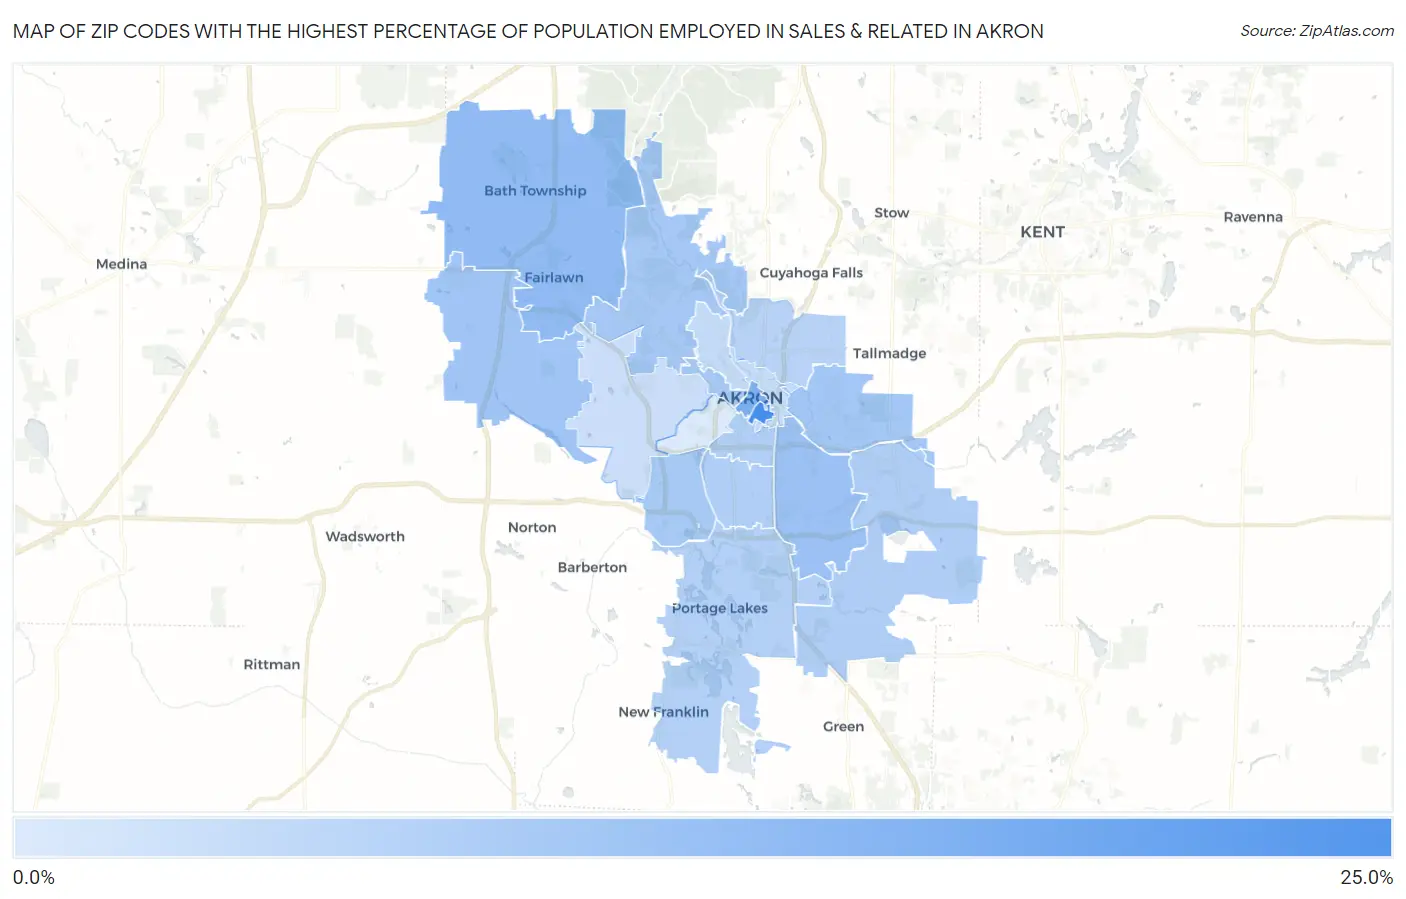
Map of Zip Codes with the Highest Percentage of Population Employed in Sales & Related in Akron
2.1%
23.7%
Zip Codes with the Highest Percentage of Population Employed in Sales & Related in Akron, OH
| Zip Code | % Employed | vs State | vs National | |
| 1. | 44325 | 23.7% | 9.1%(+14.5)#19 | 9.6%(+14.1)#745 |
| 2. | 44308 | 15.3% | 9.1%(+6.19)#69 | 9.6%(+5.74)#2,560 |
| 3. | 44333 | 12.5% | 9.1%(+3.35)#134 | 9.6%(+2.89)#5,200 |
| 4. | 44306 | 10.8% | 9.1%(+1.64)#254 | 9.6%(+1.19)#8,779 |
| 5. | 44321 | 10.2% | 9.1%(+1.02)#318 | 9.6%(+0.566)#10,545 |
| 6. | 44305 | 10.0% | 9.1%(+0.900)#334 | 9.6%(+0.448)#10,874 |
| 7. | 44313 | 9.5% | 9.1%(+0.317)#419 | 9.6%(-0.135)#12,868 |
| 8. | 44302 | 9.3% | 9.1%(+0.128)#458 | 9.6%(-0.325)#13,521 |
| 9. | 44314 | 9.2% | 9.1%(+0.062)#466 | 9.6%(-0.390)#13,774 |
| 10. | 44312 | 8.4% | 9.1%(-0.700)#566 | 9.6%(-1.15)#16,555 |
| 11. | 44311 | 8.0% | 9.1%(-1.15)#621 | 9.6%(-1.60)#18,068 |
| 12. | 44301 | 8.0% | 9.1%(-1.16)#623 | 9.6%(-1.61)#18,096 |
| 13. | 44319 | 7.8% | 9.1%(-1.34)#653 | 9.6%(-1.79)#18,663 |
| 14. | 44310 | 7.1% | 9.1%(-2.01)#747 | 9.6%(-2.46)#20,839 |
| 15. | 44303 | 5.5% | 9.1%(-3.67)#906 | 9.6%(-4.12)#24,719 |
| 16. | 44304 | 5.1% | 9.1%(-4.00)#935 | 9.6%(-4.45)#25,326 |
| 17. | 44320 | 4.6% | 9.1%(-4.51)#968 | 9.6%(-4.96)#26,143 |
| 18. | 44307 | 2.1% | 9.1%(-7.03)#1,075 | 9.6%(-7.48)#28,888 |
1
Common Questions
What are the Top 10 Zip Codes with the Highest Percentage of Population Employed in Sales & Related in Akron, OH?
Top 10 Zip Codes with the Highest Percentage of Population Employed in Sales & Related in Akron, OH are:
What zip code has the Highest Percentage of Population Employed in Sales & Related in Akron, OH?
44325 has the Highest Percentage of Population Employed in Sales & Related in Akron, OH with 23.7%.
What is the Percentage of Population Employed in Sales & Related in Akron, OH?
Percentage of Population Employed in Sales & Related in Akron is 8.0%.
What is the Percentage of Population Employed in Sales & Related in Ohio?
Percentage of Population Employed in Sales & Related in Ohio is 9.1%.
What is the Percentage of Population Employed in Sales & Related in the United States?
Percentage of Population Employed in Sales & Related in the United States is 9.6%.