Wayland, NY
Wayland Map
Wayland Overview
1,696
TOTAL POPULATION
795
MALE POPULATION
901
FEMALE POPULATION
88.24
MALES / 100 FEMALES
113.33
FEMALES / 100 MALES
37.2
MEDIAN AGE
2.7
AVG FAMILY SIZE
2.5
AVG HOUSEHOLD SIZE
$28,632
PER CAPITA INCOME
$85,766
AVG FAMILY INCOME
$65,882
AVG HOUSEHOLD INCOME
17.5%
WAGE / INCOME GAP [ % ]
82.5¢/ $1
WAGE / INCOME GAP [ $ ]
$11,597
FAMILY INCOME DEFICIT
0.40
INEQUALITY / GINI INDEX
757
LABOR FORCE [ PEOPLE ]
59.9%
PERCENT IN LABOR FORCE
5.0%
UNEMPLOYMENT RATE
Wayland Zip Codes
Wayland Area Codes
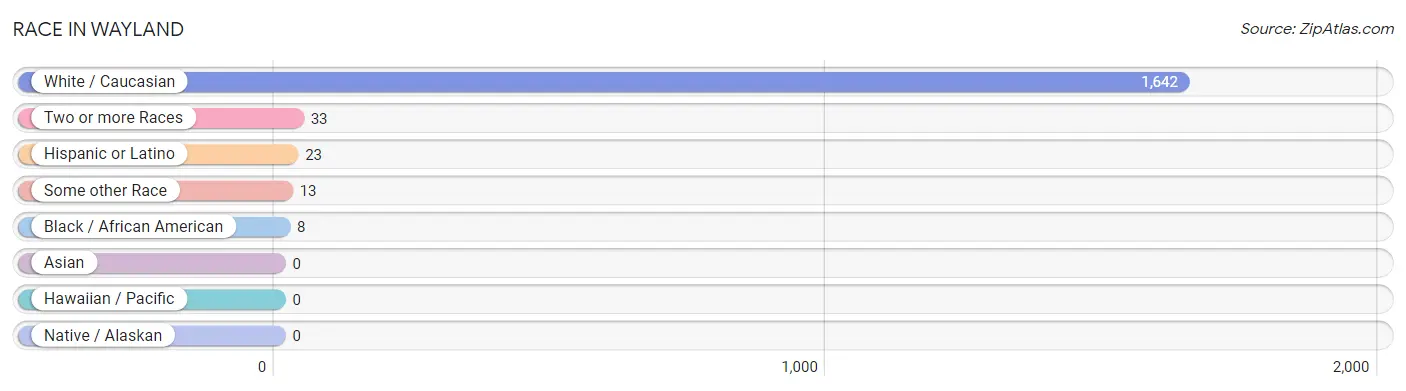
Race in Wayland
The most populous races in Wayland are White / Caucasian (1,642 | 96.8%), Two or more Races (33 | 1.9%), and Hispanic or Latino (23 | 1.4%).
| Race | # Population | % Population |
| Asian | 0 | 0.0% |
| Black / African American | 8 | 0.5% |
| Hawaiian / Pacific | 0 | 0.0% |
| Hispanic or Latino | 23 | 1.4% |
| Native / Alaskan | 0 | 0.0% |
| White / Caucasian | 1,642 | 96.8% |
| Two or more Races | 33 | 1.9% |
| Some other Race | 13 | 0.8% |
| Total | 1,696 | 100.0% |
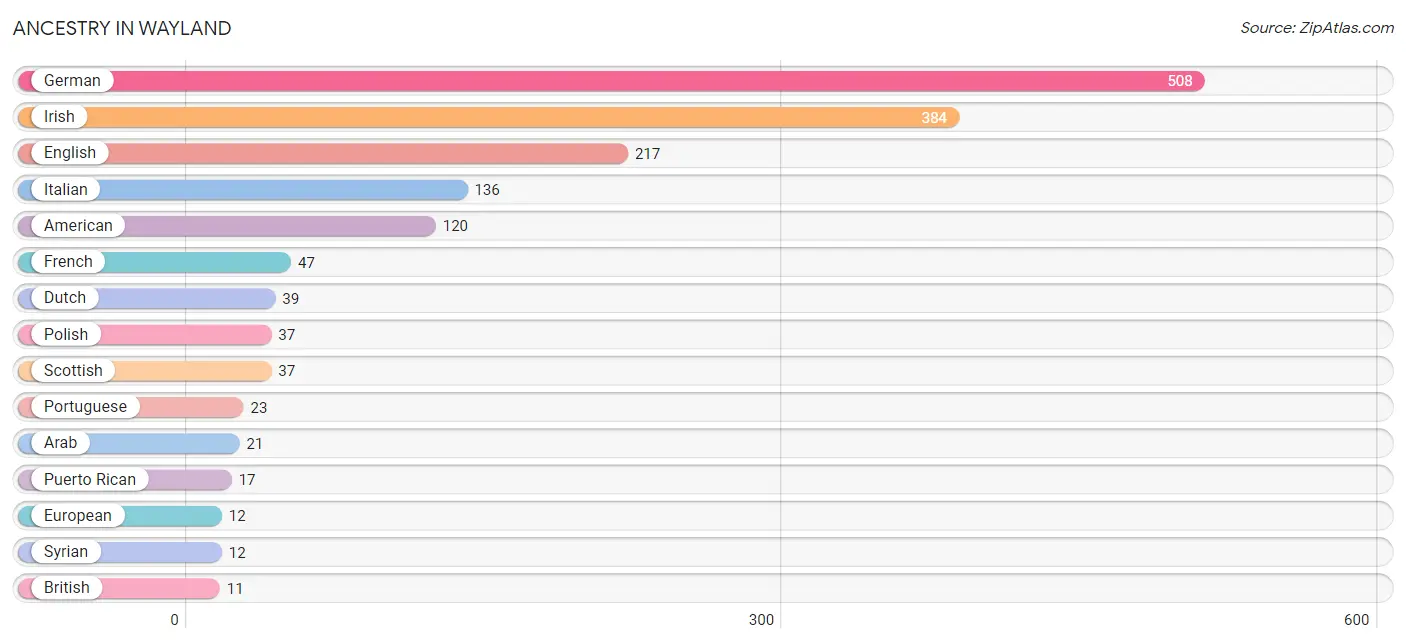
Ancestry in Wayland
The most populous ancestries reported in Wayland are German (508 | 29.9%), Irish (384 | 22.6%), English (217 | 12.8%), Italian (136 | 8.0%), and American (120 | 7.1%), together accounting for 80.5% of all Wayland residents.
| Ancestry | # Population | % Population |
| American | 120 | 7.1% |
| Arab | 21 | 1.2% |
| Belgian | 3 | 0.2% |
| Bhutanese | 9 | 0.5% |
| British | 11 | 0.6% |
| Central American | 6 | 0.4% |
| Cherokee | 11 | 0.6% |
| Czech | 4 | 0.2% |
| Czechoslovakian | 3 | 0.2% |
| Dutch | 39 | 2.3% |
| English | 217 | 12.8% |
| European | 12 | 0.7% |
| French | 47 | 2.8% |
| French Canadian | 9 | 0.5% |
| German | 508 | 29.9% |
| Honduran | 6 | 0.4% |
| Irish | 384 | 22.6% |
| Italian | 136 | 8.0% |
| Lebanese | 9 | 0.5% |
| Polish | 37 | 2.2% |
| Portuguese | 23 | 1.4% |
| Puerto Rican | 17 | 1.0% |
| Russian | 4 | 0.2% |
| Scandinavian | 6 | 0.4% |
| Scotch-Irish | 7 | 0.4% |
| Scottish | 37 | 2.2% |
| Swedish | 5 | 0.3% |
| Syrian | 12 | 0.7% |
| Welsh | 7 | 0.4% | View All 29 Rows |
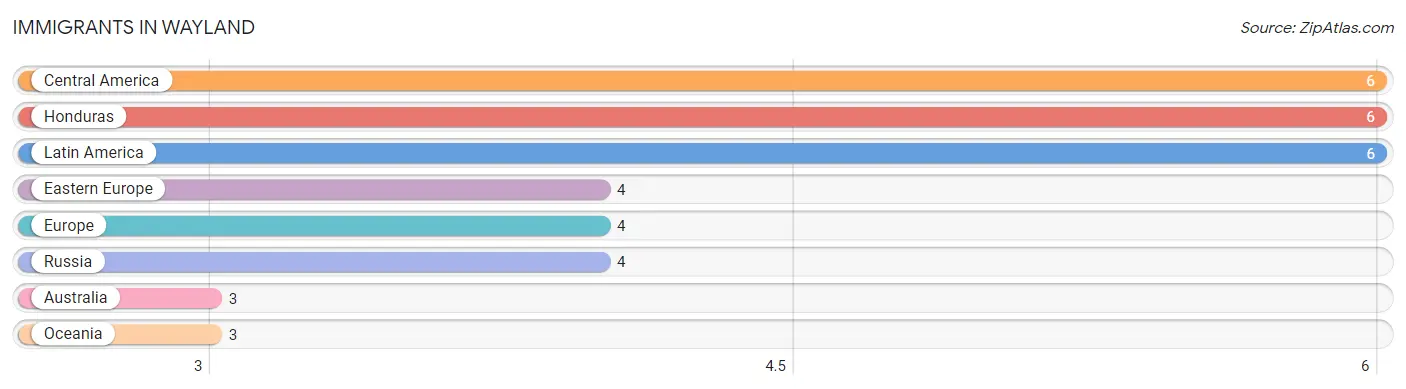
Immigrants in Wayland
The most numerous immigrant groups reported in Wayland came from Central America (6 | 0.4%), Honduras (6 | 0.4%), Latin America (6 | 0.4%), Eastern Europe (4 | 0.2%), and Europe (4 | 0.2%), together accounting for 1.5% of all Wayland residents.
| Immigration Origin | # Population | % Population |
| Australia | 3 | 0.2% |
| Central America | 6 | 0.4% |
| Eastern Europe | 4 | 0.2% |
| Europe | 4 | 0.2% |
| Honduras | 6 | 0.4% |
| Latin America | 6 | 0.4% |
| Oceania | 3 | 0.2% |
| Russia | 4 | 0.2% | View All 8 Rows |
Sex and Age in Wayland
Sex and Age in Wayland
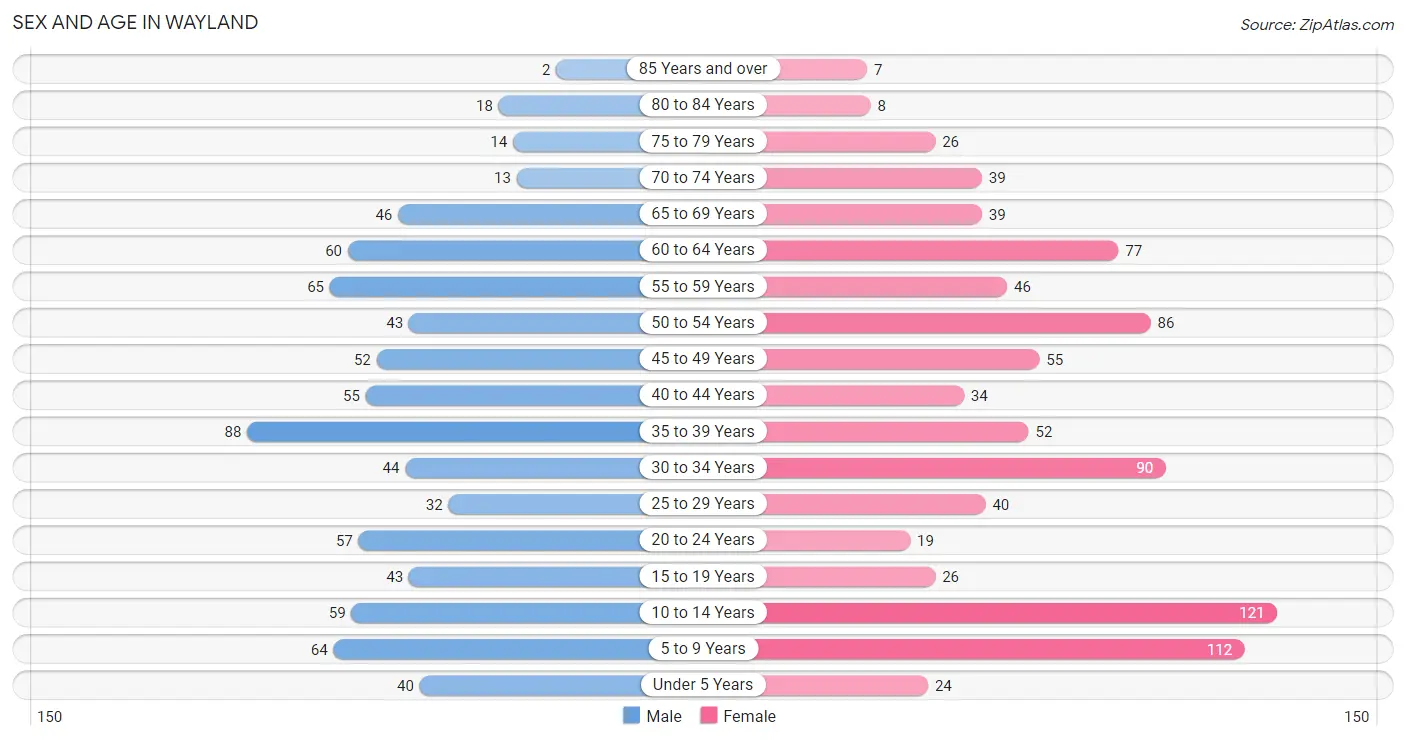
The most populous age groups in Wayland are 35 to 39 Years (88 | 11.1%) for men and 10 to 14 Years (121 | 13.4%) for women.
| Age Bracket | Male | Female |
| Under 5 Years | 40 (5.0%) | 24 (2.7%) |
| 5 to 9 Years | 64 (8.1%) | 112 (12.4%) |
| 10 to 14 Years | 59 (7.4%) | 121 (13.4%) |
| 15 to 19 Years | 43 (5.4%) | 26 (2.9%) |
| 20 to 24 Years | 57 (7.2%) | 19 (2.1%) |
| 25 to 29 Years | 32 (4.0%) | 40 (4.4%) |
| 30 to 34 Years | 44 (5.5%) | 90 (10.0%) |
| 35 to 39 Years | 88 (11.1%) | 52 (5.8%) |
| 40 to 44 Years | 55 (6.9%) | 34 (3.8%) |
| 45 to 49 Years | 52 (6.5%) | 55 (6.1%) |
| 50 to 54 Years | 43 (5.4%) | 86 (9.5%) |
| 55 to 59 Years | 65 (8.2%) | 46 (5.1%) |
| 60 to 64 Years | 60 (7.5%) | 77 (8.6%) |
| 65 to 69 Years | 46 (5.8%) | 39 (4.3%) |
| 70 to 74 Years | 13 (1.6%) | 39 (4.3%) |
| 75 to 79 Years | 14 (1.8%) | 26 (2.9%) |
| 80 to 84 Years | 18 (2.3%) | 8 (0.9%) |
| 85 Years and over | 2 (0.3%) | 7 (0.8%) |
| Total | 795 (100.0%) | 901 (100.0%) |
Families and Households in Wayland
Median Family Size in Wayland
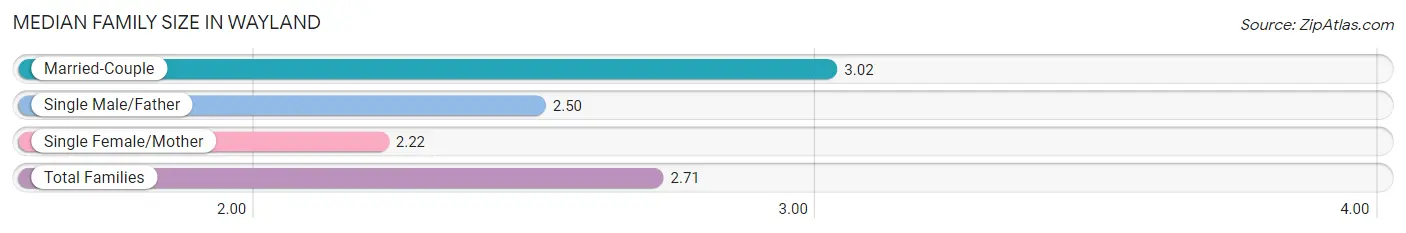
The median family size in Wayland is 2.71 persons per family, with married-couple families (264 | 60.3%) accounting for the largest median family size of 3.02 persons per family. On the other hand, single female/mother families (148 | 33.8%) represent the smallest median family size with 2.22 persons per family.
| Family Type | # Families | Family Size |
| Married-Couple | 264 (60.3%) | 3.02 |
| Single Male/Father | 26 (5.9%) | 2.50 |
| Single Female/Mother | 148 (33.8%) | 2.22 |
| Total Families | 438 (100.0%) | 2.71 |
Median Household Size in Wayland
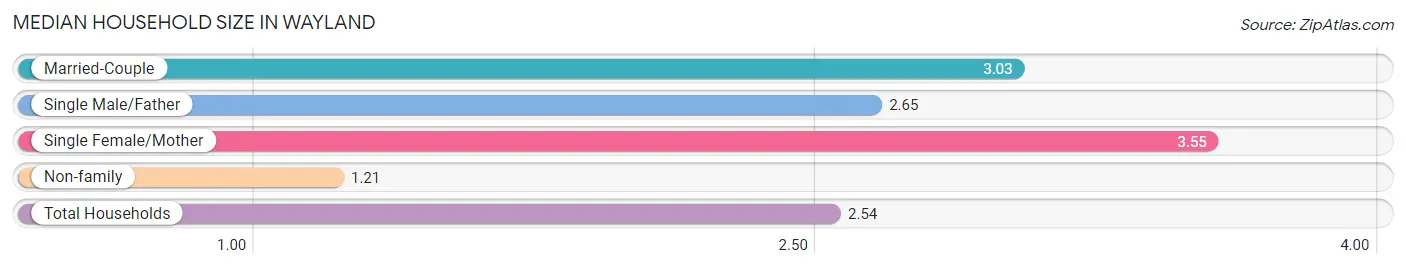
The median household size in Wayland is 2.54 persons per household, with single female/mother households (148 | 22.8%) accounting for the largest median household size of 3.55 persons per household. non-family households (210 | 32.4%) represent the smallest median household size with 1.21 persons per household.
| Household Type | # Households | Household Size |
| Married-Couple | 264 (40.7%) | 3.03 |
| Single Male/Father | 26 (4.0%) | 2.65 |
| Single Female/Mother | 148 (22.8%) | 3.55 |
| Non-family | 210 (32.4%) | 1.21 |
| Total Households | 648 (100.0%) | 2.54 |
Household Size by Marriage Status in Wayland
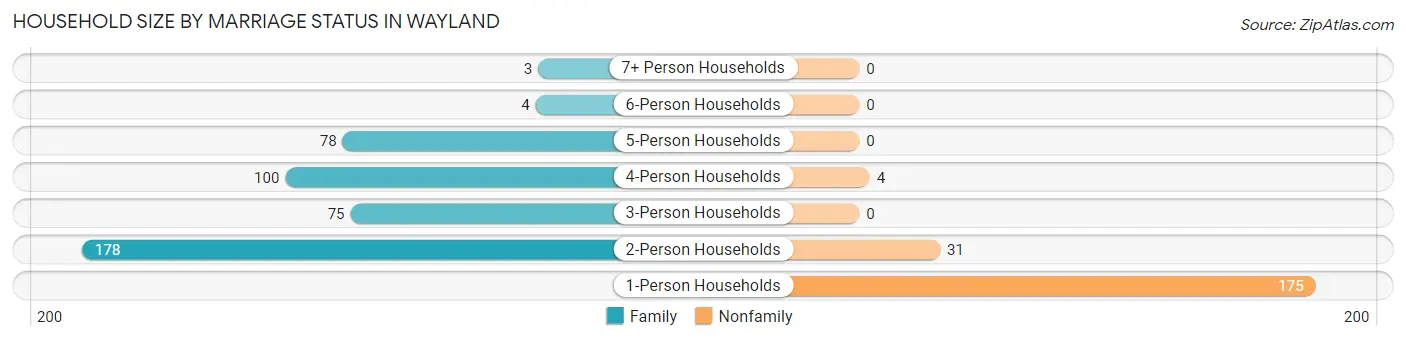
Out of a total of 648 households in Wayland, 438 (67.6%) are family households, while 210 (32.4%) are nonfamily households. The most numerous type of family households are 2-person households, comprising 178, and the most common type of nonfamily households are 1-person households, comprising 175.
| Household Size | Family Households | Nonfamily Households |
| 1-Person Households | - | 175 (27.0%) |
| 2-Person Households | 178 (27.5%) | 31 (4.8%) |
| 3-Person Households | 75 (11.6%) | 0 (0.0%) |
| 4-Person Households | 100 (15.4%) | 4 (0.6%) |
| 5-Person Households | 78 (12.0%) | 0 (0.0%) |
| 6-Person Households | 4 (0.6%) | 0 (0.0%) |
| 7+ Person Households | 3 (0.5%) | 0 (0.0%) |
| Total | 438 (67.6%) | 210 (32.4%) |
Female Fertility in Wayland
Fertility by Age in Wayland
Average fertility rate in Wayland is 23.0 births per 1,000 women. Women in the age bracket of 20 to 34 years have the highest fertility rate with 54.0 births per 1,000 women. Women in the age bracket of 20 to 34 years acount for 100.0% of all women with births.
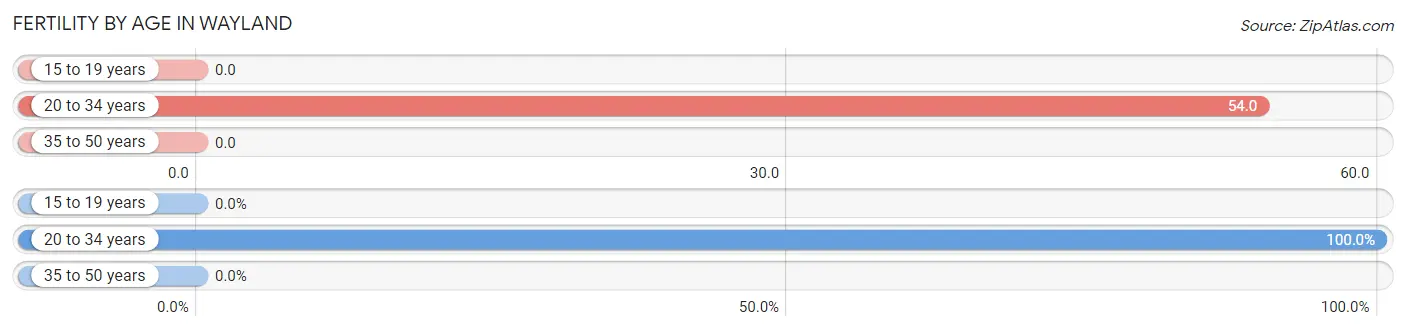
| Age Bracket | Women with Births | Births / 1,000 Women |
| 15 to 19 years | 0 (0.0%) | 0.0 |
| 20 to 34 years | 8 (100.0%) | 54.0 |
| 35 to 50 years | 0 (0.0%) | 0.0 |
| Total | 8 (100.0%) | 23.0 |
Fertility by Age by Marriage Status in Wayland
37.5% of women with births (8) in Wayland are married. The highest percentage of unmarried women with births falls into 20 to 34 years age bracket with 62.5% of them unmarried at the time of birth, while the lowest percentage of unmarried women with births belong to 20 to 34 years age bracket with 62.5% of them unmarried.
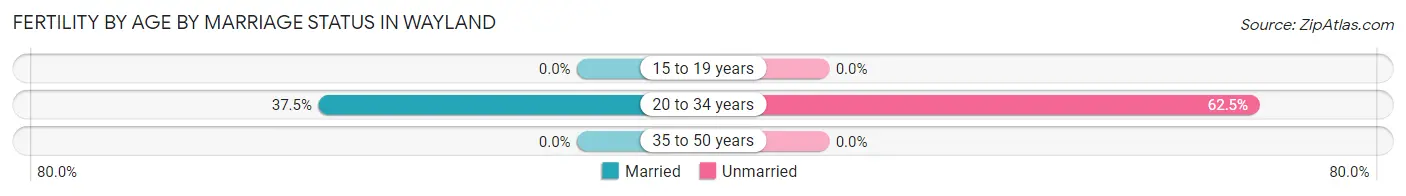
| Age Bracket | Married | Unmarried |
| 15 to 19 years | 0 (0.0%) | 0 (0.0%) |
| 20 to 34 years | 3 (37.5%) | 5 (62.5%) |
| 35 to 50 years | 0 (0.0%) | 0 (0.0%) |
| Total | 3 (37.5%) | 5 (62.5%) |
Fertility by Education in Wayland
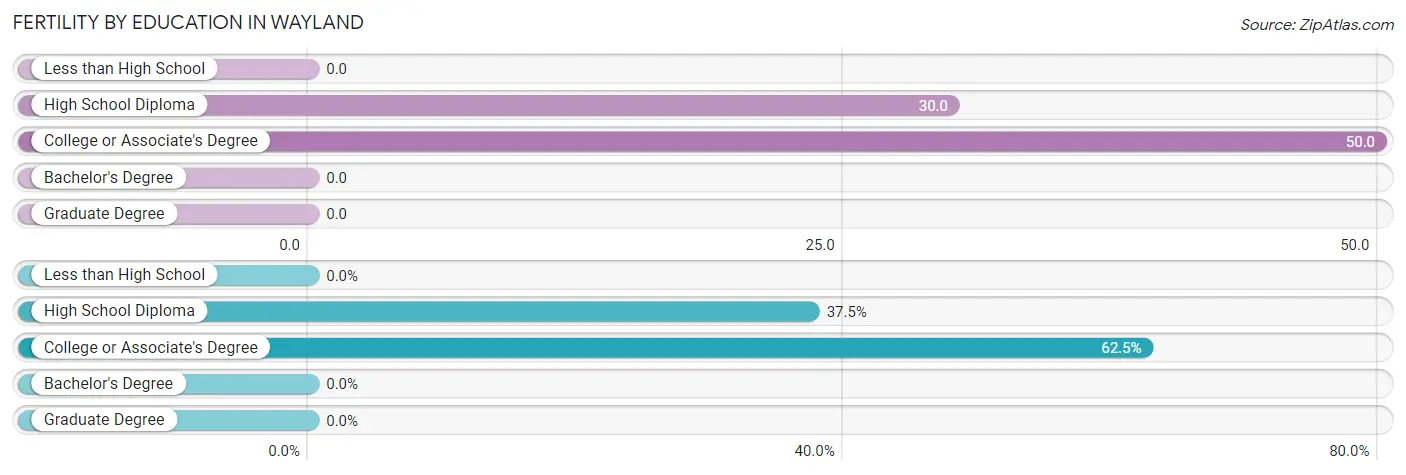
| Educational Attainment | Women with Births | Births / 1,000 Women |
| Less than High School | 0 (0.0%) | 0.0 |
| High School Diploma | 3 (37.5%) | 30.0 |
| College or Associate's Degree | 5 (62.5%) | 50.0 |
| Bachelor's Degree | 0 (0.0%) | 0.0 |
| Graduate Degree | 0 (0.0%) | 0.0 |
| Total | 8 (100.0%) | 23.0 |
Fertility by Education by Marriage Status in Wayland
62.5% of women with births in Wayland are unmarried. Women with the educational attainment of high school diploma are most likely to be married with 100.0% of them married at childbirth, while women with the educational attainment of college or associate's degree are least likely to be married with 100.0% of them unmarried at childbirth.
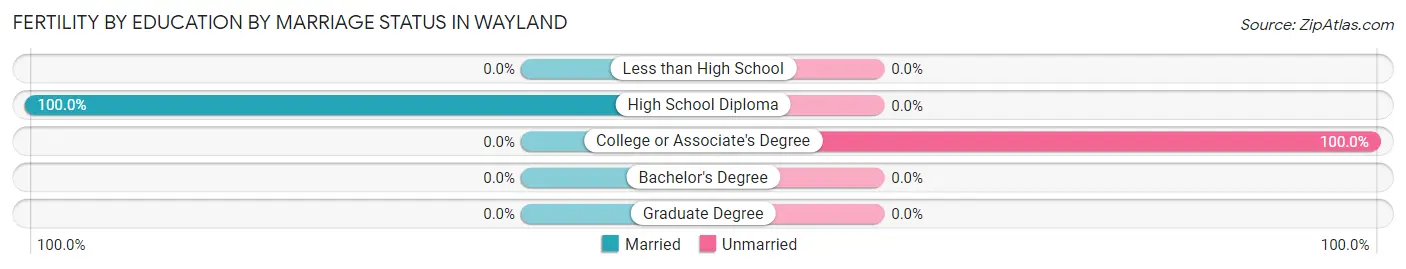
| Educational Attainment | Married | Unmarried |
| Less than High School | 0 (0.0%) | 0 (0.0%) |
| High School Diploma | 3 (100.0%) | 0 (0.0%) |
| College or Associate's Degree | 0 (0.0%) | 5 (100.0%) |
| Bachelor's Degree | 0 (0.0%) | 0 (0.0%) |
| Graduate Degree | 0 (0.0%) | 0 (0.0%) |
| Total | 3 (37.5%) | 5 (62.5%) |
Income in Wayland
Income Overview in Wayland
Per Capita Income in Wayland is $28,632, while median incomes of families and households are $85,766 and $65,882 respectively.
| Characteristic | Number | Measure |
| Per Capita Income | 1,696 | $28,632 |
| Median Family Income | 438 | $85,766 |
| Mean Family Income | 438 | $83,341 |
| Median Household Income | 648 | $65,882 |
| Mean Household Income | 648 | $73,768 |
| Income Deficit | 438 | $11,597 |
| Wage / Income Gap (%) | 1,696 | 17.53% |
| Wage / Income Gap ($) | 1,696 | 82.47¢ per $1 |
| Gini / Inequality Index | 1,696 | 0.40 |
Earnings by Sex in Wayland
Average Earnings in Wayland are $37,949, $38,730 for men and $31,940 for women, a difference of 17.5%.
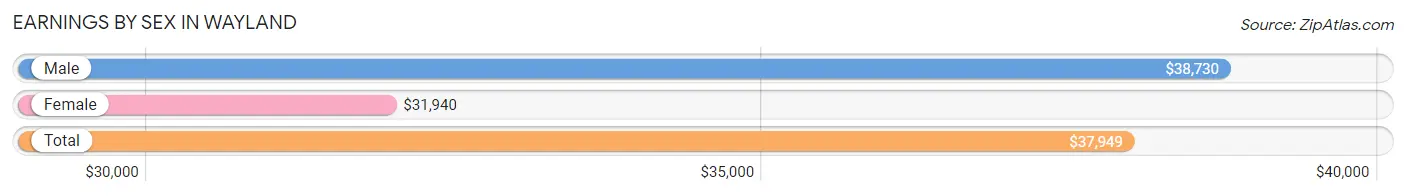
| Sex | Number | Average Earnings |
| Male | 440 (54.9%) | $38,730 |
| Female | 361 (45.1%) | $31,940 |
| Total | 801 (100.0%) | $37,949 |
Earnings by Sex by Income Bracket in Wayland
The most common earnings brackets in Wayland are $35,000 to $39,999 for men (68 | 15.4%) and $75,000 to $99,999 for women (87 | 24.1%).
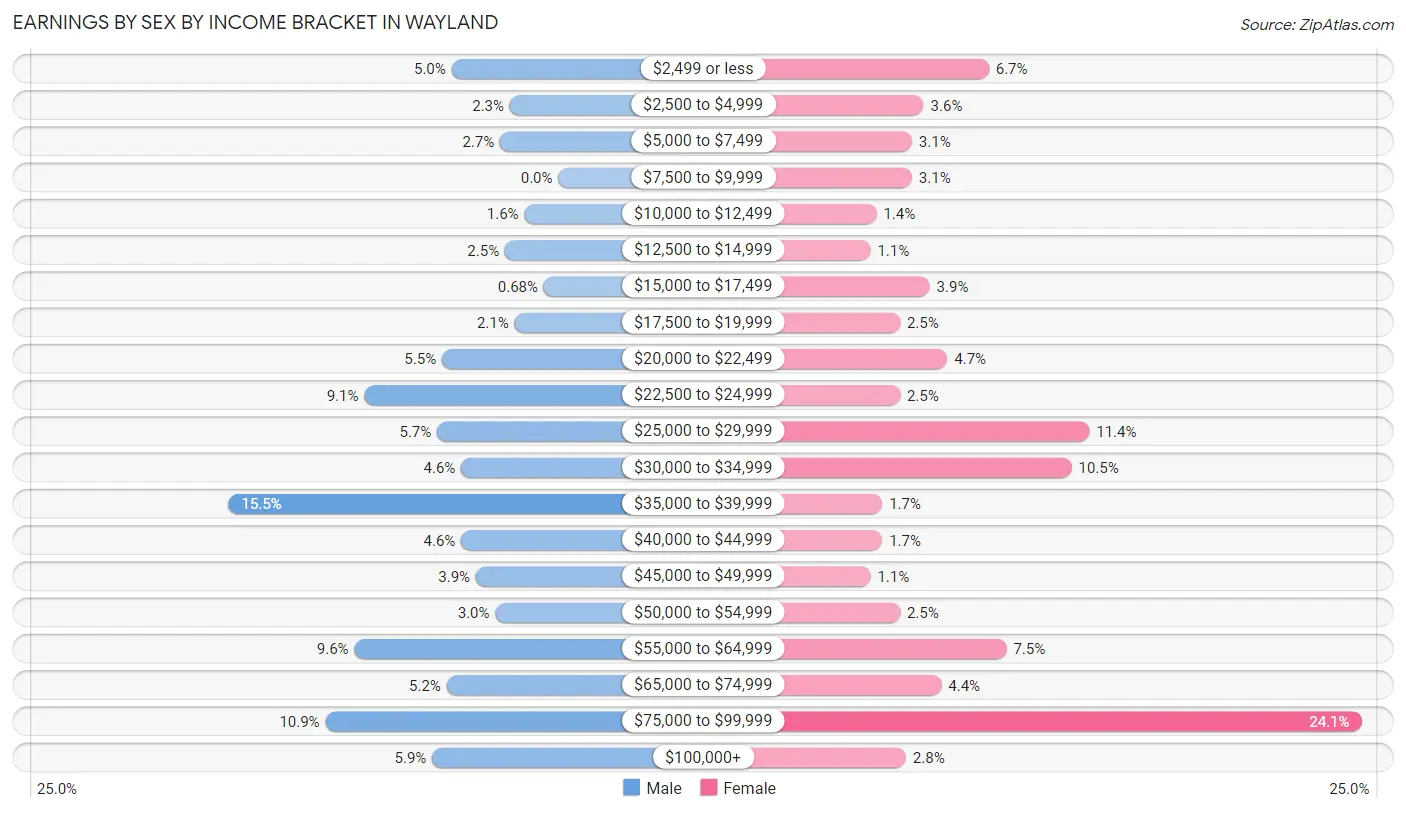
| Income | Male | Female |
| $2,499 or less | 22 (5.0%) | 24 (6.7%) |
| $2,500 to $4,999 | 10 (2.3%) | 13 (3.6%) |
| $5,000 to $7,499 | 12 (2.7%) | 11 (3.0%) |
| $7,500 to $9,999 | 0 (0.0%) | 11 (3.0%) |
| $10,000 to $12,499 | 7 (1.6%) | 5 (1.4%) |
| $12,500 to $14,999 | 11 (2.5%) | 4 (1.1%) |
| $15,000 to $17,499 | 3 (0.7%) | 14 (3.9%) |
| $17,500 to $19,999 | 9 (2.1%) | 9 (2.5%) |
| $20,000 to $22,499 | 24 (5.4%) | 17 (4.7%) |
| $22,500 to $24,999 | 40 (9.1%) | 9 (2.5%) |
| $25,000 to $29,999 | 25 (5.7%) | 41 (11.4%) |
| $30,000 to $34,999 | 20 (4.5%) | 38 (10.5%) |
| $35,000 to $39,999 | 68 (15.4%) | 6 (1.7%) |
| $40,000 to $44,999 | 20 (4.5%) | 6 (1.7%) |
| $45,000 to $49,999 | 17 (3.9%) | 4 (1.1%) |
| $50,000 to $54,999 | 13 (2.9%) | 9 (2.5%) |
| $55,000 to $64,999 | 42 (9.6%) | 27 (7.5%) |
| $65,000 to $74,999 | 23 (5.2%) | 16 (4.4%) |
| $75,000 to $99,999 | 48 (10.9%) | 87 (24.1%) |
| $100,000+ | 26 (5.9%) | 10 (2.8%) |
| Total | 440 (100.0%) | 361 (100.0%) |
Earnings by Sex by Educational Attainment in Wayland
Average earnings in Wayland are $40,694 for men and $32,414 for women, a difference of 20.3%. Men with an educational attainment of college or associate's degree enjoy the highest average annual earnings of $51,429, while those with high school diploma education earn the least with $38,821. Women with an educational attainment of graduate degree earn the most with the average annual earnings of $86,176, while those with high school diploma education have the smallest earnings of $25,298.
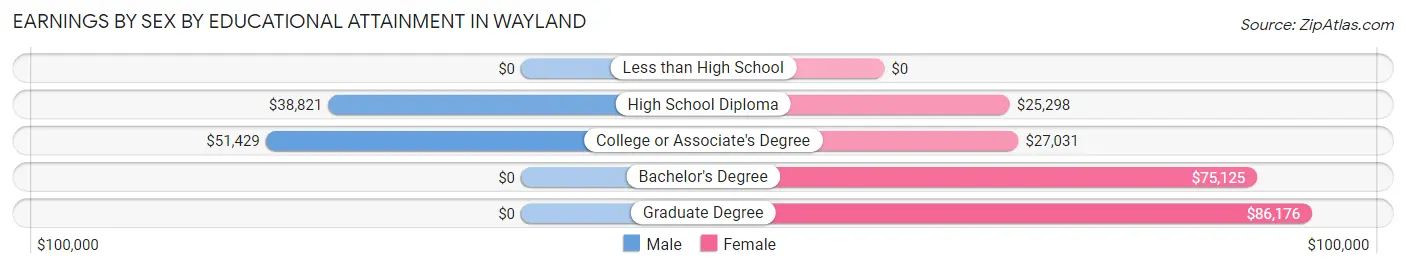
| Educational Attainment | Male Income | Female Income |
| Less than High School | - | - |
| High School Diploma | $38,821 | $25,298 |
| College or Associate's Degree | $51,429 | $27,031 |
| Bachelor's Degree | - | - |
| Graduate Degree | - | - |
| Total | $40,694 | $32,414 |
Family Income in Wayland
Family Income Brackets in Wayland
According to the Wayland family income data, there are 125 families falling into the $75,000 to $99,999 income range, which is the most common income bracket and makes up 28.5% of all families. Conversely, the $200,000+ income bracket is the least frequent group with only 3 families (0.7%) belonging to this category.
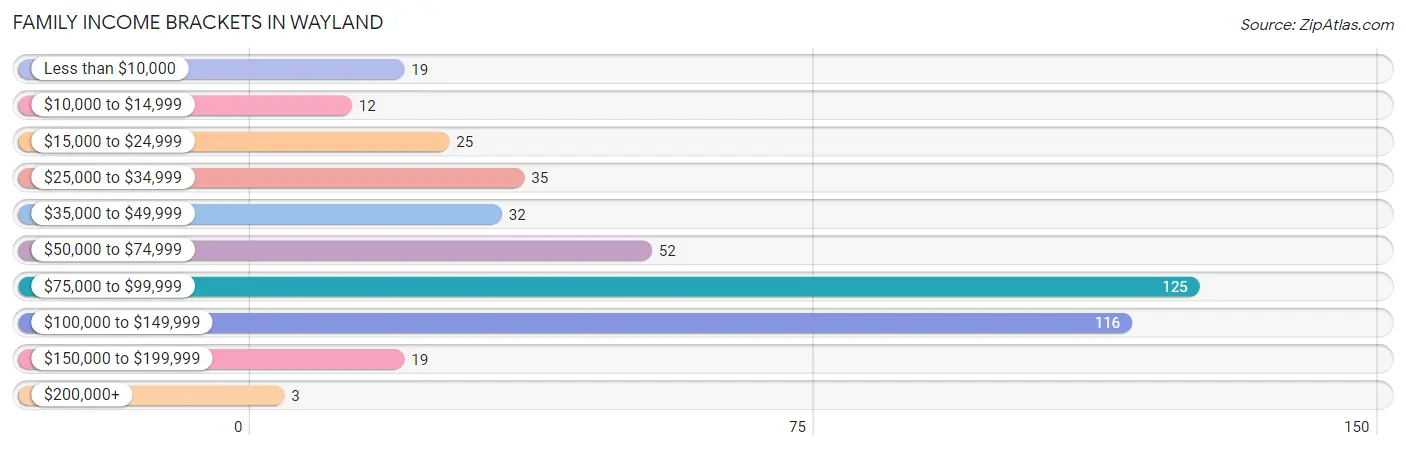
| Income Bracket | # Families | % Families |
| Less than $10,000 | 19 | 4.3% |
| $10,000 to $14,999 | 12 | 2.7% |
| $15,000 to $24,999 | 25 | 5.7% |
| $25,000 to $34,999 | 35 | 8.0% |
| $35,000 to $49,999 | 32 | 7.3% |
| $50,000 to $74,999 | 52 | 11.9% |
| $75,000 to $99,999 | 125 | 28.5% |
| $100,000 to $149,999 | 116 | 26.5% |
| $150,000 to $199,999 | 19 | 4.3% |
| $200,000+ | 3 | 0.7% |
Family Income by Famaliy Size in Wayland
4-person families (85 | 19.4%) account for the highest median family income in Wayland with $103,750 per family, while 2-person families (245 | 55.9%) have the highest median income of $42,966 per family member.
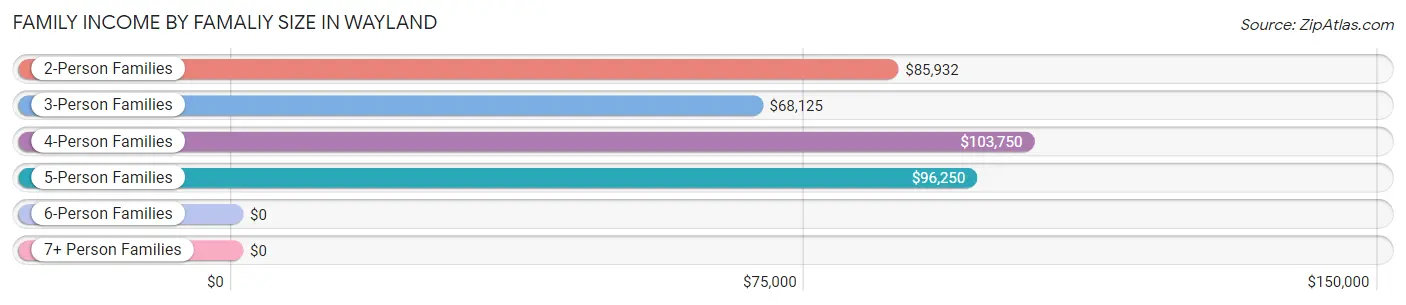
| Income Bracket | # Families | Median Income |
| 2-Person Families | 245 (55.9%) | $85,932 |
| 3-Person Families | 78 (17.8%) | $68,125 |
| 4-Person Families | 85 (19.4%) | $103,750 |
| 5-Person Families | 23 (5.2%) | $96,250 |
| 6-Person Families | 4 (0.9%) | $0 |
| 7+ Person Families | 3 (0.7%) | $0 |
| Total | 438 (100.0%) | $85,766 |
Family Income by Number of Earners in Wayland
The median family income in Wayland is $85,766, with families comprising 3+ earners (24) having the highest median family income of $145,192, while families with no earners (76) have the lowest median family income of $25,833, accounting for 5.5% and 17.3% of families, respectively.
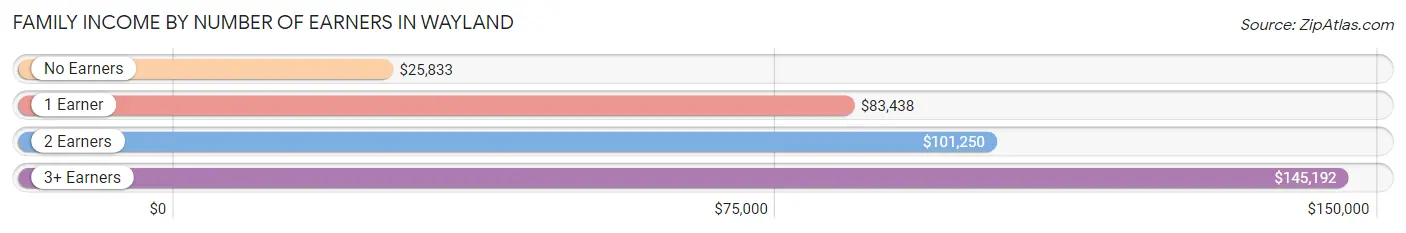
| Number of Earners | # Families | Median Income |
| No Earners | 76 (17.3%) | $25,833 |
| 1 Earner | 165 (37.7%) | $83,438 |
| 2 Earners | 173 (39.5%) | $101,250 |
| 3+ Earners | 24 (5.5%) | $145,192 |
| Total | 438 (100.0%) | $85,766 |
Household Income in Wayland
Household Income Brackets in Wayland
With 178 households falling in the category, the $100,000 to $149,999 income range is the most frequent in Wayland, accounting for 27.5% of all households. In contrast, only 3 households (0.5%) fall into the $200,000+ income bracket, making it the least populous group.
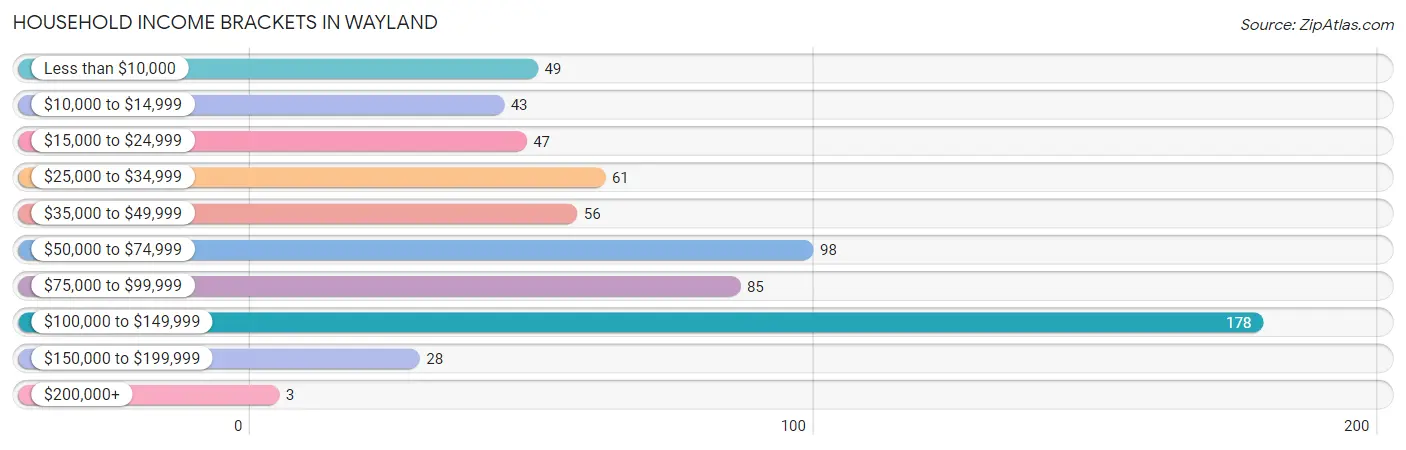
| Income Bracket | # Households | % Households |
| Less than $10,000 | 49 | 7.6% |
| $10,000 to $14,999 | 43 | 6.6% |
| $15,000 to $24,999 | 47 | 7.3% |
| $25,000 to $34,999 | 61 | 9.4% |
| $35,000 to $49,999 | 56 | 8.6% |
| $50,000 to $74,999 | 98 | 15.1% |
| $75,000 to $99,999 | 85 | 13.1% |
| $100,000 to $149,999 | 178 | 27.5% |
| $150,000 to $199,999 | 28 | 4.3% |
| $200,000+ | 3 | 0.5% |
Household Income by Householder Age in Wayland
The median household income in Wayland is $65,882, with the highest median household income of $84,375 found in the 45 to 64 years age bracket for the primary householder. A total of 264 households (40.7%) fall into this category. Meanwhile, the 15 to 24 years age bracket for the primary householder has the lowest median household income of $0, with 8 households (1.2%) in this group.
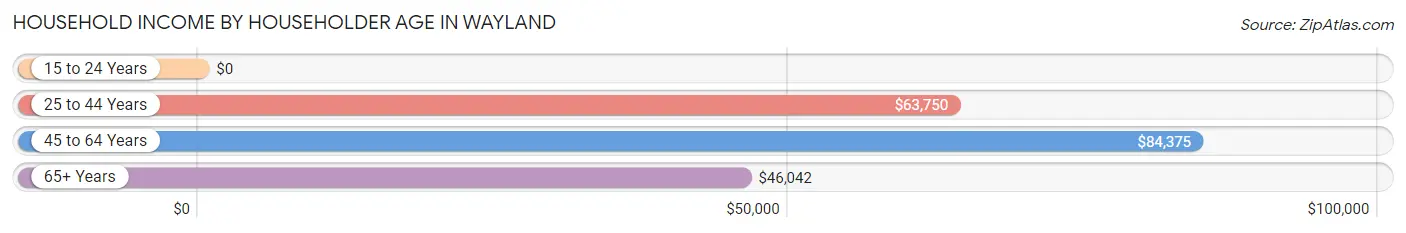
| Income Bracket | # Households | Median Income |
| 15 to 24 Years | 8 (1.2%) | $0 |
| 25 to 44 Years | 221 (34.1%) | $63,750 |
| 45 to 64 Years | 264 (40.7%) | $84,375 |
| 65+ Years | 155 (23.9%) | $46,042 |
| Total | 648 (100.0%) | $65,882 |
Poverty in Wayland
Income Below Poverty by Sex and Age in Wayland
With 17.3% poverty level for males and 20.4% for females among the residents of Wayland, 5 year old males and under 5 year old females are the most vulnerable to poverty, with 9 males (50.0%) and 16 females (66.7%) in their respective age groups living below the poverty level.
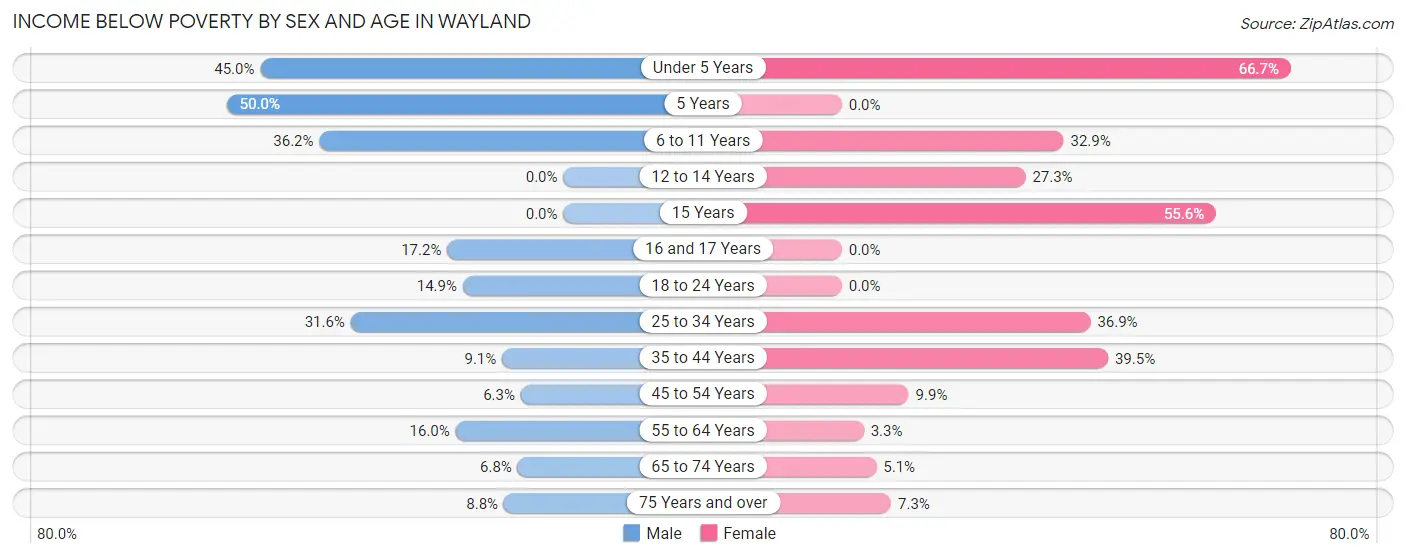
| Age Bracket | Male | Female |
| Under 5 Years | 18 (45.0%) | 16 (66.7%) |
| 5 Years | 9 (50.0%) | 0 (0.0%) |
| 6 to 11 Years | 25 (36.2%) | 27 (32.9%) |
| 12 to 14 Years | 0 (0.0%) | 3 (27.3%) |
| 15 Years | 0 (0.0%) | 5 (55.6%) |
| 16 and 17 Years | 5 (17.2%) | 0 (0.0%) |
| 18 to 24 Years | 10 (14.9%) | 0 (0.0%) |
| 25 to 34 Years | 24 (31.6%) | 48 (36.9%) |
| 35 to 44 Years | 13 (9.1%) | 34 (39.5%) |
| 45 to 54 Years | 6 (6.3%) | 14 (9.9%) |
| 55 to 64 Years | 20 (16.0%) | 4 (3.3%) |
| 65 to 74 Years | 4 (6.8%) | 4 (5.1%) |
| 75 Years and over | 3 (8.8%) | 3 (7.3%) |
| Total | 137 (17.3%) | 158 (20.4%) |
Income Above Poverty by Sex and Age in Wayland
According to the poverty statistics in Wayland, males aged 12 to 14 years and females aged 5 years are the age groups that are most secure financially, with 100.0% of males and 100.0% of females in these age groups living above the poverty line.
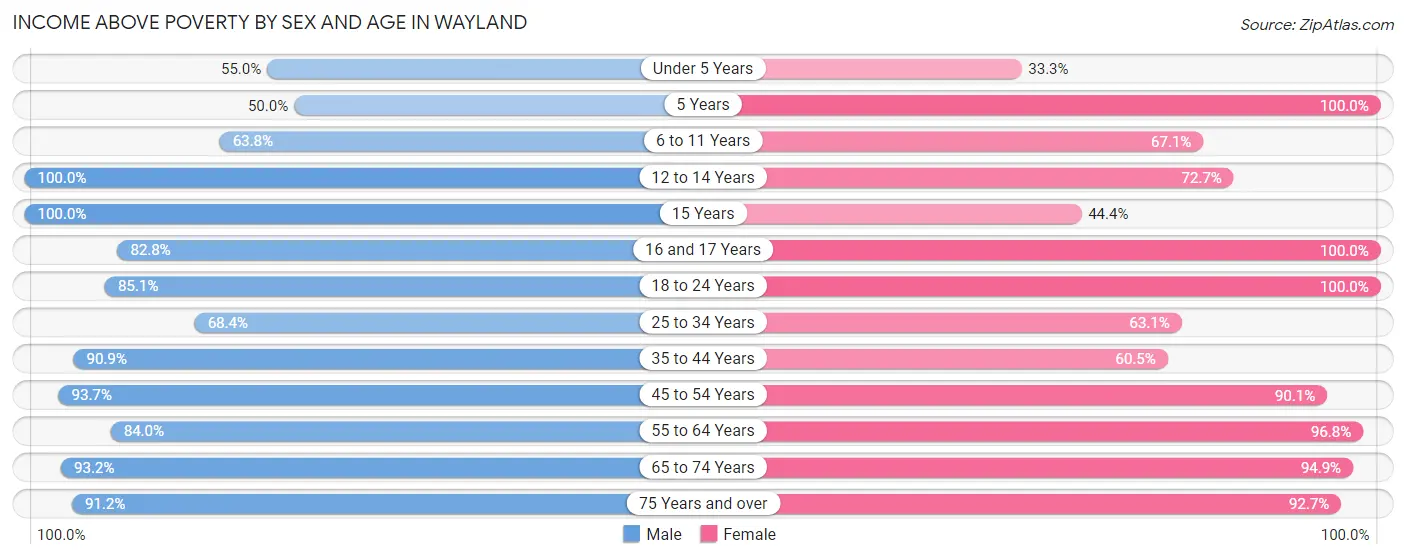
| Age Bracket | Male | Female |
| Under 5 Years | 22 (55.0%) | 8 (33.3%) |
| 5 Years | 9 (50.0%) | 15 (100.0%) |
| 6 to 11 Years | 44 (63.8%) | 55 (67.1%) |
| 12 to 14 Years | 31 (100.0%) | 8 (72.7%) |
| 15 Years | 4 (100.0%) | 4 (44.4%) |
| 16 and 17 Years | 24 (82.8%) | 17 (100.0%) |
| 18 to 24 Years | 57 (85.1%) | 19 (100.0%) |
| 25 to 34 Years | 52 (68.4%) | 82 (63.1%) |
| 35 to 44 Years | 130 (90.9%) | 52 (60.5%) |
| 45 to 54 Years | 89 (93.7%) | 127 (90.1%) |
| 55 to 64 Years | 105 (84.0%) | 119 (96.8%) |
| 65 to 74 Years | 55 (93.2%) | 74 (94.9%) |
| 75 Years and over | 31 (91.2%) | 38 (92.7%) |
| Total | 653 (82.7%) | 618 (79.6%) |
Income Below Poverty Among Married-Couple Families in Wayland
The poverty statistics for married-couple families in Wayland show that 8.3% or 22 of the total 264 families live below the poverty line. Families with 3 or 4 children have the highest poverty rate of 20.8%, comprising of 5 families. On the other hand, families with 5 or more children have the lowest poverty rate of 0.0%, which includes 0 families.
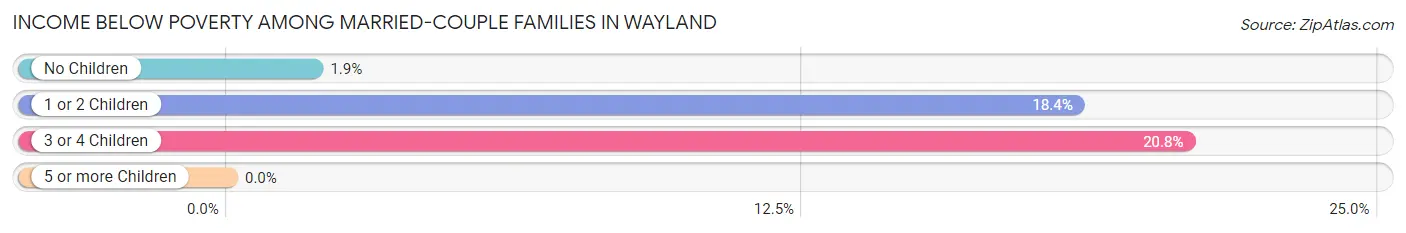
| Children | Above Poverty | Below Poverty |
| No Children | 158 (98.1%) | 3 (1.9%) |
| 1 or 2 Children | 62 (81.6%) | 14 (18.4%) |
| 3 or 4 Children | 19 (79.2%) | 5 (20.8%) |
| 5 or more Children | 3 (100.0%) | 0 (0.0%) |
| Total | 242 (91.7%) | 22 (8.3%) |
Income Below Poverty Among Single-Parent Households in Wayland
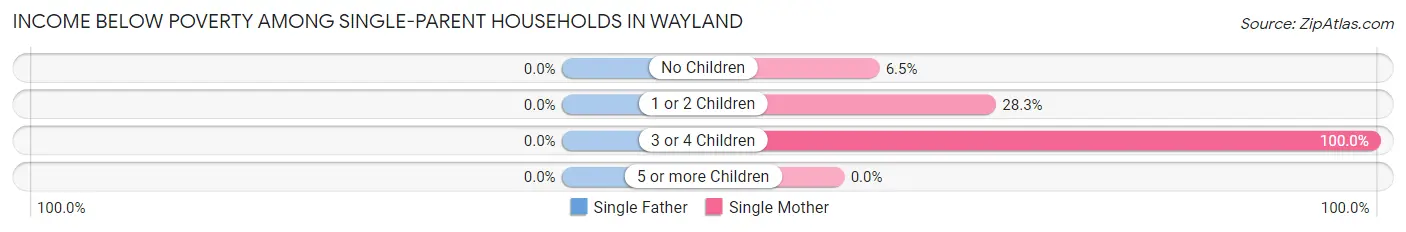
| Children | Single Father | Single Mother |
| No Children | 0 (0.0%) | 3 (6.5%) |
| 1 or 2 Children | 0 (0.0%) | 26 (28.3%) |
| 3 or 4 Children | 0 (0.0%) | 10 (100.0%) |
| 5 or more Children | 0 (0.0%) | 0 (0.0%) |
| Total | 0 (0.0%) | 39 (26.4%) |
Income Below Poverty Among Married-Couple vs Single-Parent Households in Wayland
The poverty data for Wayland shows that 22 of the married-couple family households (8.3%) and 39 of the single-parent households (22.4%) are living below the poverty level. Within the married-couple family households, those with 3 or 4 children have the highest poverty rate, with 5 households (20.8%) falling below the poverty line. Among the single-parent households, those with 3 or 4 children have the highest poverty rate, with 10 household (76.9%) living below poverty.
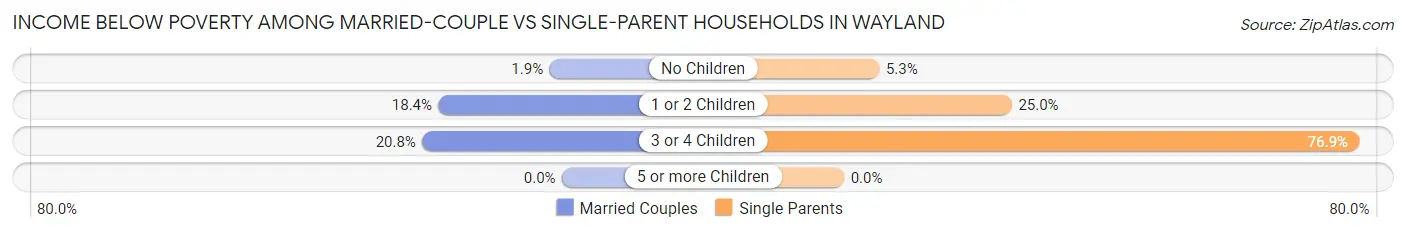
| Children | Married-Couple Families | Single-Parent Households |
| No Children | 3 (1.9%) | 3 (5.3%) |
| 1 or 2 Children | 14 (18.4%) | 26 (25.0%) |
| 3 or 4 Children | 5 (20.8%) | 10 (76.9%) |
| 5 or more Children | 0 (0.0%) | 0 (0.0%) |
| Total | 22 (8.3%) | 39 (22.4%) |
Employment Characteristics in Wayland
Employment by Class of Employer in Wayland
Among the 709 employed individuals in Wayland, private company employees (488 | 68.8%), not-for-profit organizations (68 | 9.6%), and self-employed (not incorporated) (57 | 8.0%) make up the most common classes of employment.
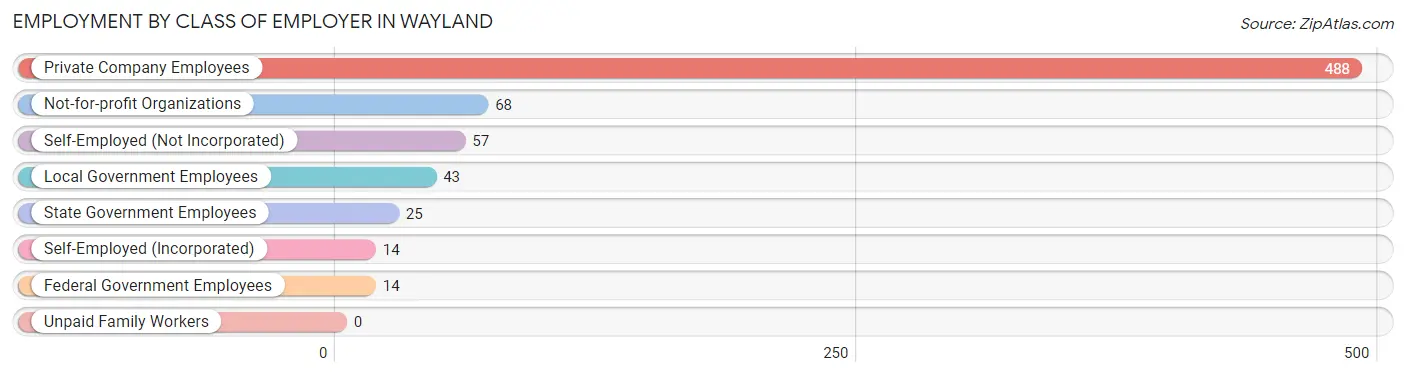
| Employer Class | # Employees | % Employees |
| Private Company Employees | 488 | 68.8% |
| Self-Employed (Incorporated) | 14 | 2.0% |
| Self-Employed (Not Incorporated) | 57 | 8.0% |
| Not-for-profit Organizations | 68 | 9.6% |
| Local Government Employees | 43 | 6.1% |
| State Government Employees | 25 | 3.5% |
| Federal Government Employees | 14 | 2.0% |
| Unpaid Family Workers | 0 | 0.0% |
| Total | 709 | 100.0% |
Employment Status by Age in Wayland
According to the labor force statistics for Wayland, out of the total population over 16 years of age (1,263), 59.9% or 757 individuals are in the labor force, with 5.0% or 38 of them unemployed. The age group with the highest labor force participation rate is 30 to 34 years, with 83.6% or 112 individuals in the labor force. Within the labor force, the 16 to 19 years age range has the highest percentage of unemployed individuals, with 41.2% or 7 of them being unemployed.
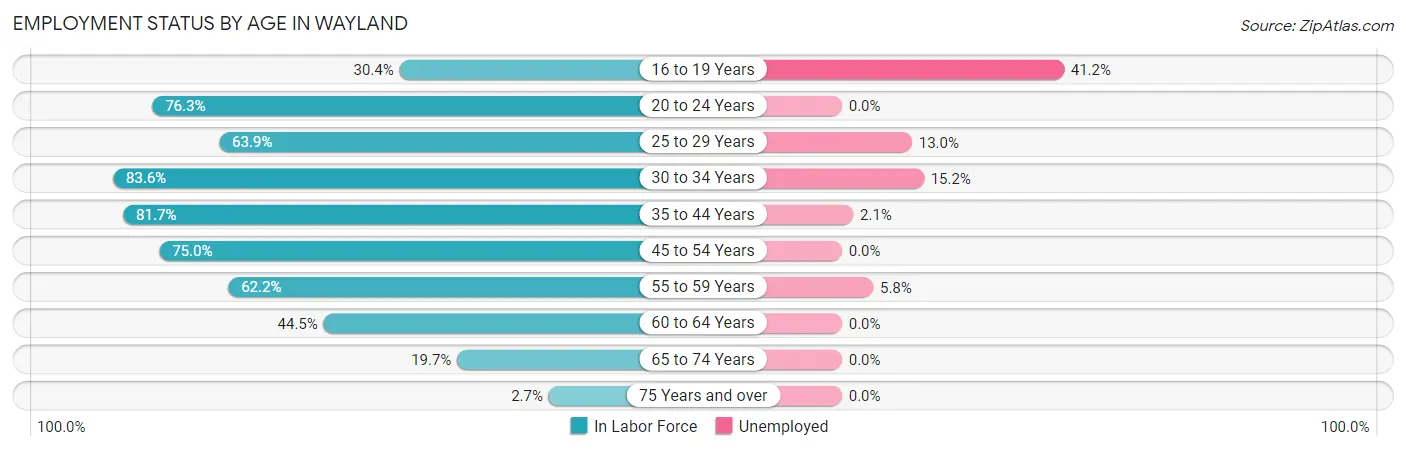
| Age Bracket | In Labor Force | Unemployed |
| 16 to 19 Years | 17 (30.4%) | 7 (41.2%) |
| 20 to 24 Years | 58 (76.3%) | 0 (0.0%) |
| 25 to 29 Years | 46 (63.9%) | 6 (13.0%) |
| 30 to 34 Years | 112 (83.6%) | 17 (15.2%) |
| 35 to 44 Years | 187 (81.7%) | 4 (2.1%) |
| 45 to 54 Years | 177 (75.0%) | 0 (0.0%) |
| 55 to 59 Years | 69 (62.2%) | 4 (5.8%) |
| 60 to 64 Years | 61 (44.5%) | 0 (0.0%) |
| 65 to 74 Years | 27 (19.7%) | 0 (0.0%) |
| 75 Years and over | 2 (2.7%) | 0 (0.0%) |
| Total | 757 (59.9%) | 38 (5.0%) |
Employment Status by Educational Attainment in Wayland
According to labor force statistics for Wayland, 70.9% of individuals (652) out of the total population between 25 and 64 years of age (919) are in the labor force, with 4.8% or 31 of them being unemployed. The group with the highest labor force participation rate are those with the educational attainment of bachelor's degree or higher, with 95.1% or 155 individuals in the labor force. Within the labor force, individuals with less than high school education have the highest percentage of unemployment, with 9.5% or 4 of them being unemployed.
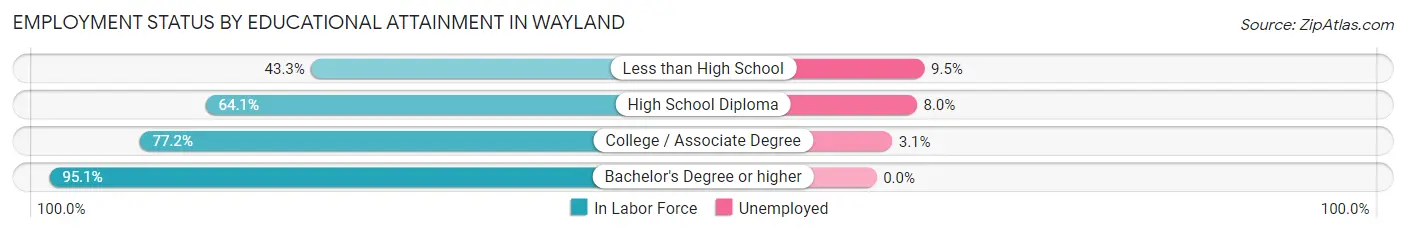
| Educational Attainment | In Labor Force | Unemployed |
| Less than High School | 42 (43.3%) | 9 (9.5%) |
| High School Diploma | 262 (64.1%) | 33 (8.0%) |
| College / Associate Degree | 193 (77.2%) | 8 (3.1%) |
| Bachelor's Degree or higher | 155 (95.1%) | 0 (0.0%) |
| Total | 652 (70.9%) | 44 (4.8%) |
Employment Occupations by Sex in Wayland
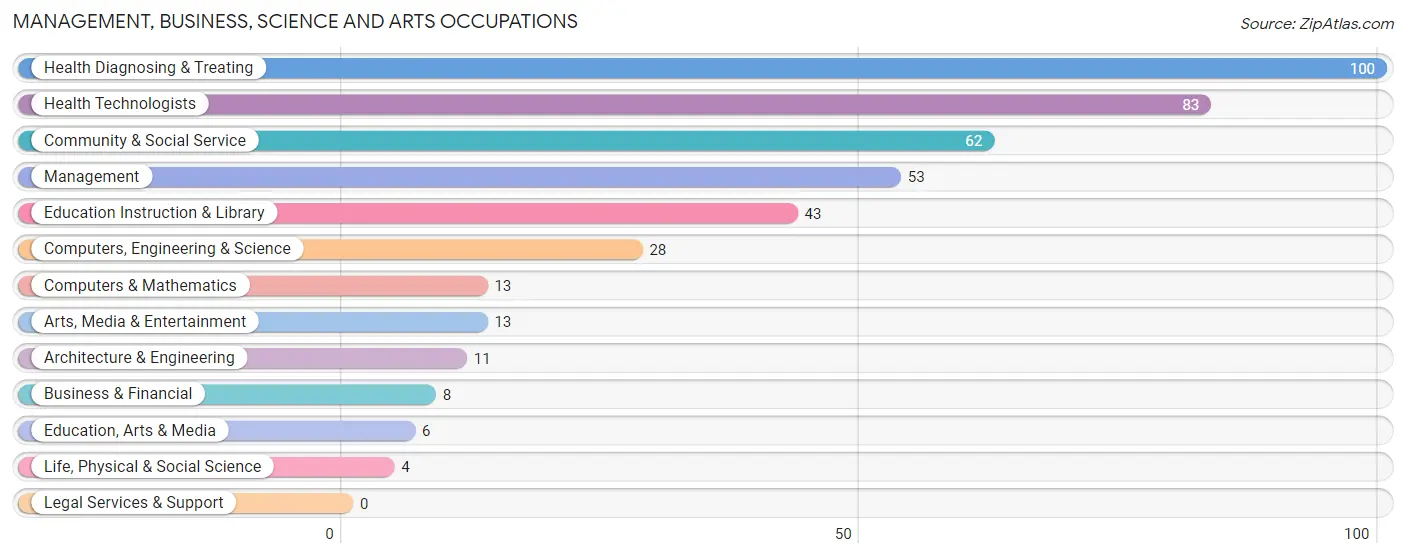
Management, Business, Science and Arts Occupations
The most common Management, Business, Science and Arts occupations in Wayland are Health Diagnosing & Treating (100 | 13.9%), Health Technologists (83 | 11.6%), Community & Social Service (62 | 8.6%), Management (53 | 7.4%), and Education Instruction & Library (43 | 6.0%).
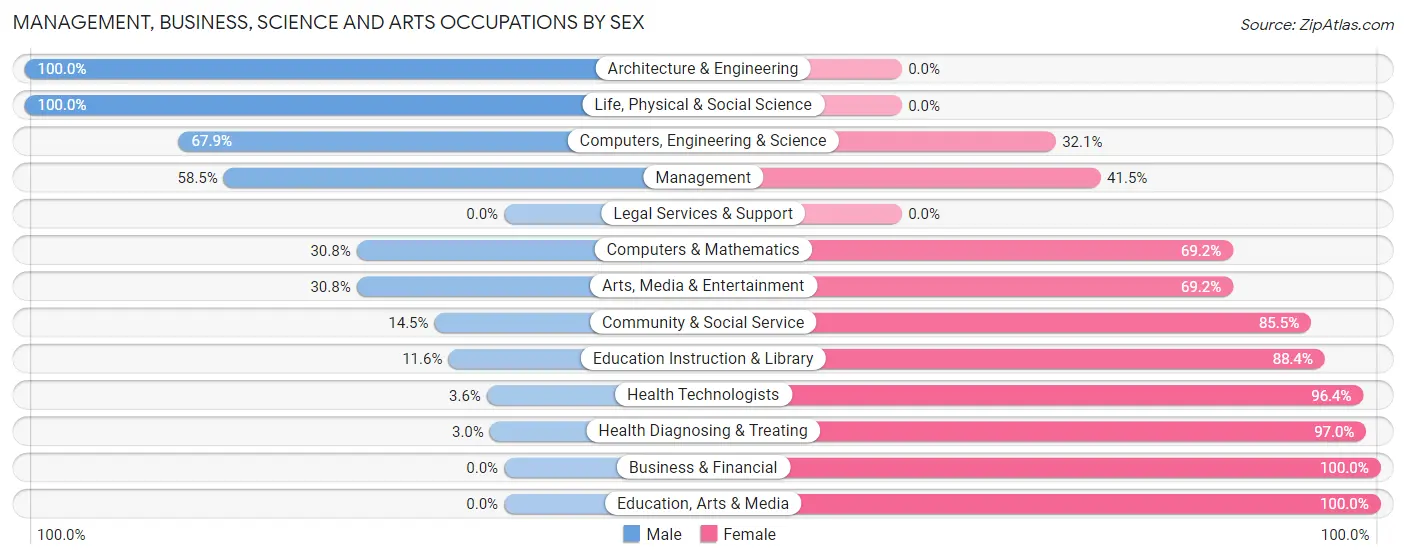
Management, Business, Science and Arts Occupations by Sex
Within the Management, Business, Science and Arts occupations in Wayland, the most male-oriented occupations are Architecture & Engineering (100.0%), Life, Physical & Social Science (100.0%), and Computers, Engineering & Science (67.9%), while the most female-oriented occupations are Business & Financial (100.0%), Education, Arts & Media (100.0%), and Health Diagnosing & Treating (97.0%).
| Occupation | Male | Female |
| Management | 31 (58.5%) | 22 (41.5%) |
| Business & Financial | 0 (0.0%) | 8 (100.0%) |
| Computers, Engineering & Science | 19 (67.9%) | 9 (32.1%) |
| Computers & Mathematics | 4 (30.8%) | 9 (69.2%) |
| Architecture & Engineering | 11 (100.0%) | 0 (0.0%) |
| Life, Physical & Social Science | 4 (100.0%) | 0 (0.0%) |
| Community & Social Service | 9 (14.5%) | 53 (85.5%) |
| Education, Arts & Media | 0 (0.0%) | 6 (100.0%) |
| Legal Services & Support | 0 (0.0%) | 0 (0.0%) |
| Education Instruction & Library | 5 (11.6%) | 38 (88.4%) |
| Arts, Media & Entertainment | 4 (30.8%) | 9 (69.2%) |
| Health Diagnosing & Treating | 3 (3.0%) | 97 (97.0%) |
| Health Technologists | 3 (3.6%) | 80 (96.4%) |
| Total (Category) | 62 (24.7%) | 189 (75.3%) |
| Total (Overall) | 401 (55.8%) | 317 (44.2%) |
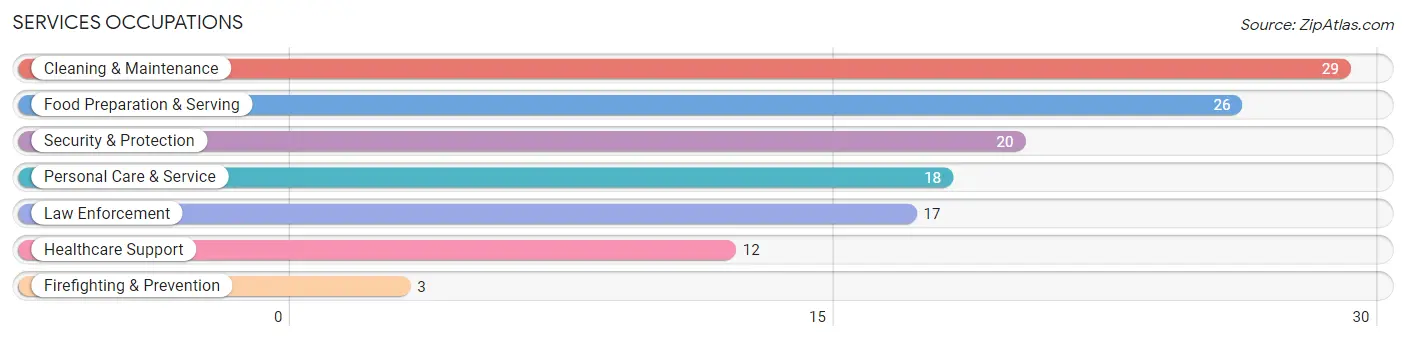
Services Occupations
The most common Services occupations in Wayland are Cleaning & Maintenance (29 | 4.0%), Food Preparation & Serving (26 | 3.6%), Security & Protection (20 | 2.8%), Personal Care & Service (18 | 2.5%), and Law Enforcement (17 | 2.4%).
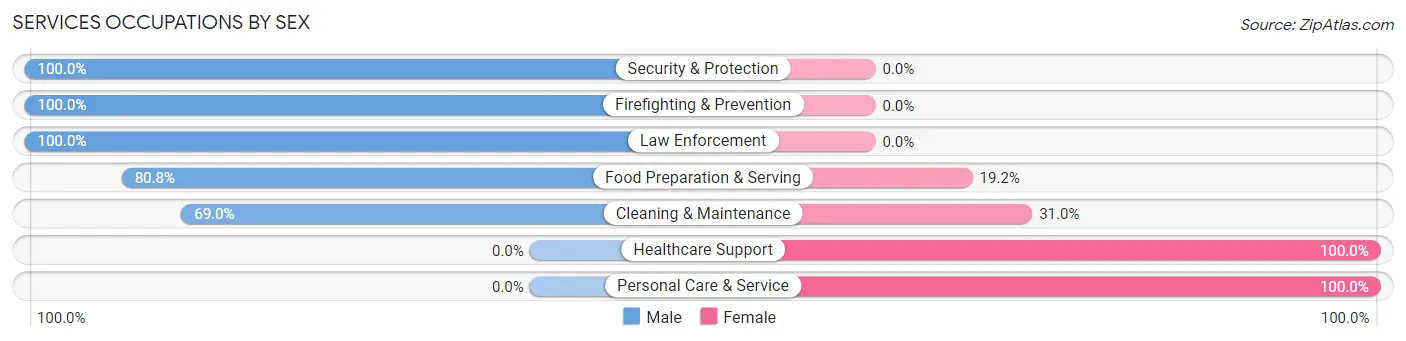
Services Occupations by Sex
Within the Services occupations in Wayland, the most male-oriented occupations are Security & Protection (100.0%), Firefighting & Prevention (100.0%), and Law Enforcement (100.0%), while the most female-oriented occupations are Healthcare Support (100.0%), Personal Care & Service (100.0%), and Cleaning & Maintenance (31.0%).
| Occupation | Male | Female |
| Healthcare Support | 0 (0.0%) | 12 (100.0%) |
| Security & Protection | 20 (100.0%) | 0 (0.0%) |
| Firefighting & Prevention | 3 (100.0%) | 0 (0.0%) |
| Law Enforcement | 17 (100.0%) | 0 (0.0%) |
| Food Preparation & Serving | 21 (80.8%) | 5 (19.2%) |
| Cleaning & Maintenance | 20 (69.0%) | 9 (31.0%) |
| Personal Care & Service | 0 (0.0%) | 18 (100.0%) |
| Total (Category) | 61 (58.1%) | 44 (41.9%) |
| Total (Overall) | 401 (55.8%) | 317 (44.2%) |
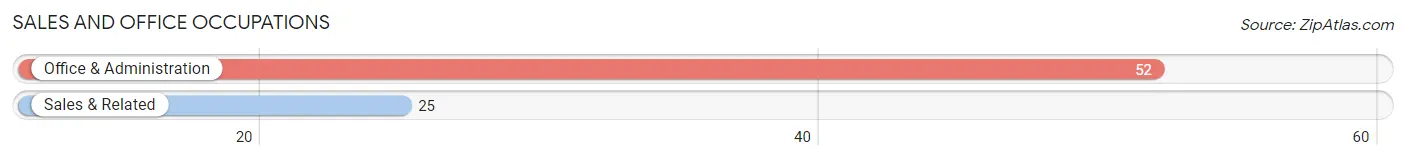
Sales and Office Occupations
The most common Sales and Office occupations in Wayland are Office & Administration (52 | 7.2%), and Sales & Related (25 | 3.5%).
Sales and Office Occupations by Sex
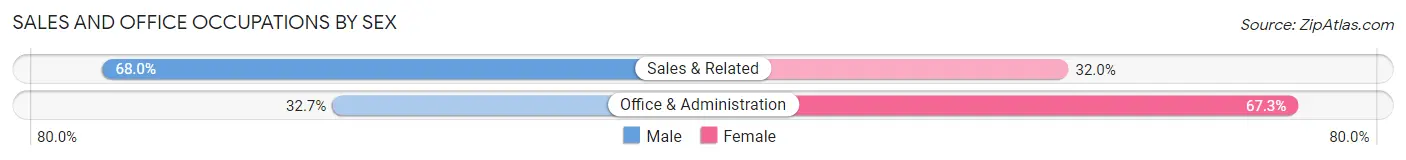
| Occupation | Male | Female |
| Sales & Related | 17 (68.0%) | 8 (32.0%) |
| Office & Administration | 17 (32.7%) | 35 (67.3%) |
| Total (Category) | 34 (44.2%) | 43 (55.8%) |
| Total (Overall) | 401 (55.8%) | 317 (44.2%) |
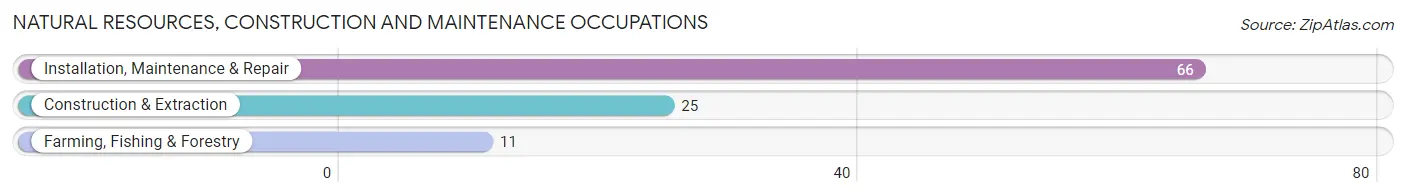
Natural Resources, Construction and Maintenance Occupations
The most common Natural Resources, Construction and Maintenance occupations in Wayland are Installation, Maintenance & Repair (66 | 9.2%), Construction & Extraction (25 | 3.5%), and Farming, Fishing & Forestry (11 | 1.5%).
Natural Resources, Construction and Maintenance Occupations by Sex
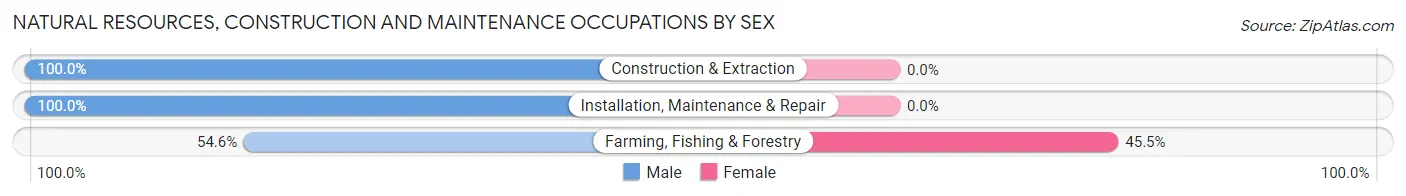
| Occupation | Male | Female |
| Farming, Fishing & Forestry | 6 (54.5%) | 5 (45.5%) |
| Construction & Extraction | 25 (100.0%) | 0 (0.0%) |
| Installation, Maintenance & Repair | 66 (100.0%) | 0 (0.0%) |
| Total (Category) | 97 (95.1%) | 5 (4.9%) |
| Total (Overall) | 401 (55.8%) | 317 (44.2%) |
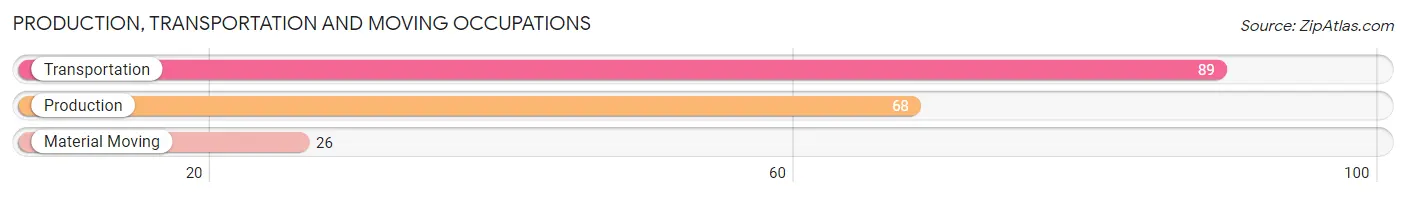
Production, Transportation and Moving Occupations
The most common Production, Transportation and Moving occupations in Wayland are Transportation (89 | 12.4%), Production (68 | 9.5%), and Material Moving (26 | 3.6%).
Production, Transportation and Moving Occupations by Sex
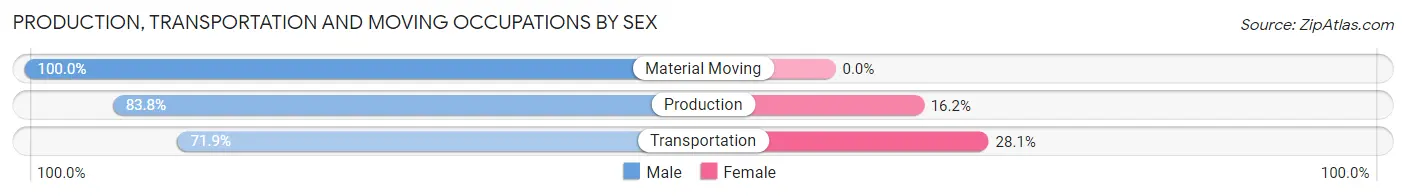
| Occupation | Male | Female |
| Production | 57 (83.8%) | 11 (16.2%) |
| Transportation | 64 (71.9%) | 25 (28.1%) |
| Material Moving | 26 (100.0%) | 0 (0.0%) |
| Total (Category) | 147 (80.3%) | 36 (19.7%) |
| Total (Overall) | 401 (55.8%) | 317 (44.2%) |
Employment Industries by Sex in Wayland
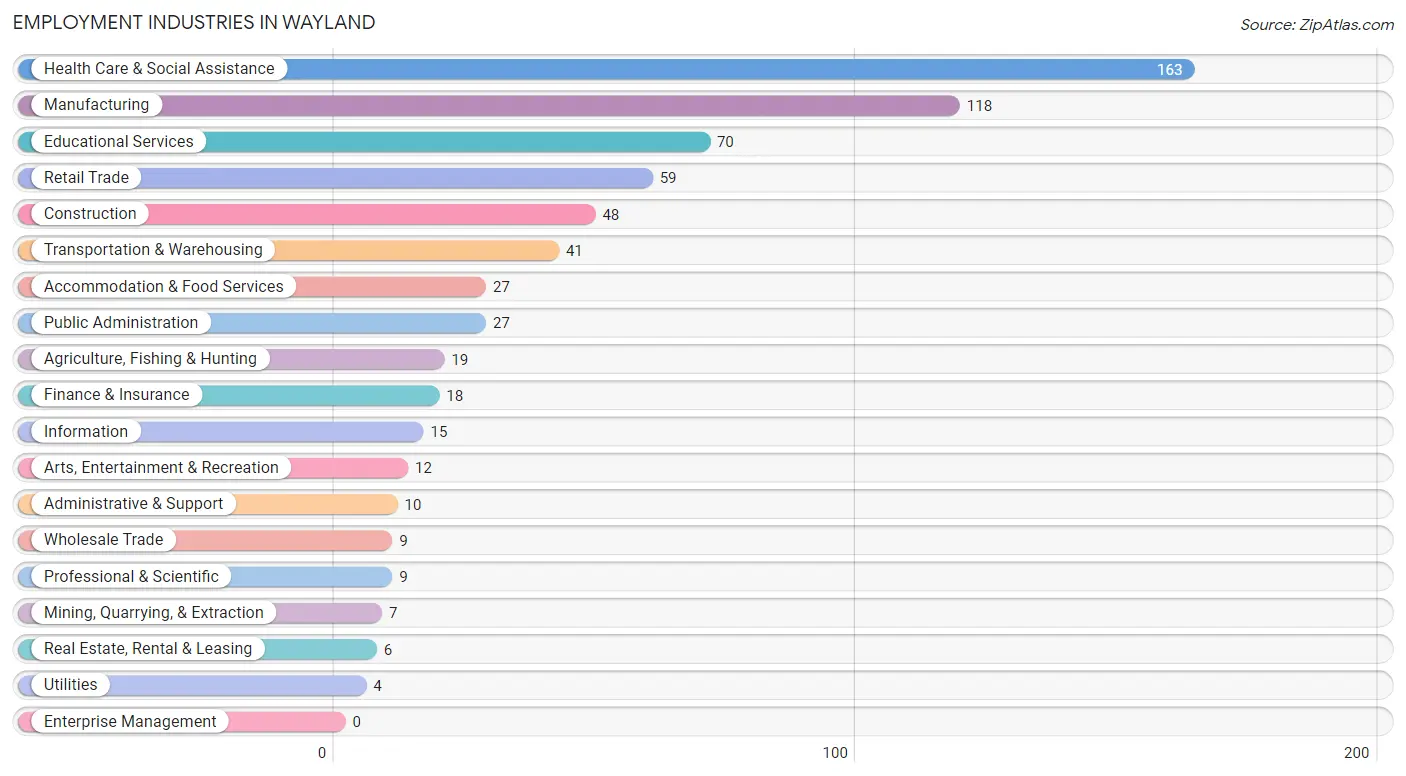
Employment Industries in Wayland
The major employment industries in Wayland include Health Care & Social Assistance (163 | 22.7%), Manufacturing (118 | 16.4%), Educational Services (70 | 9.8%), Retail Trade (59 | 8.2%), and Construction (48 | 6.7%).
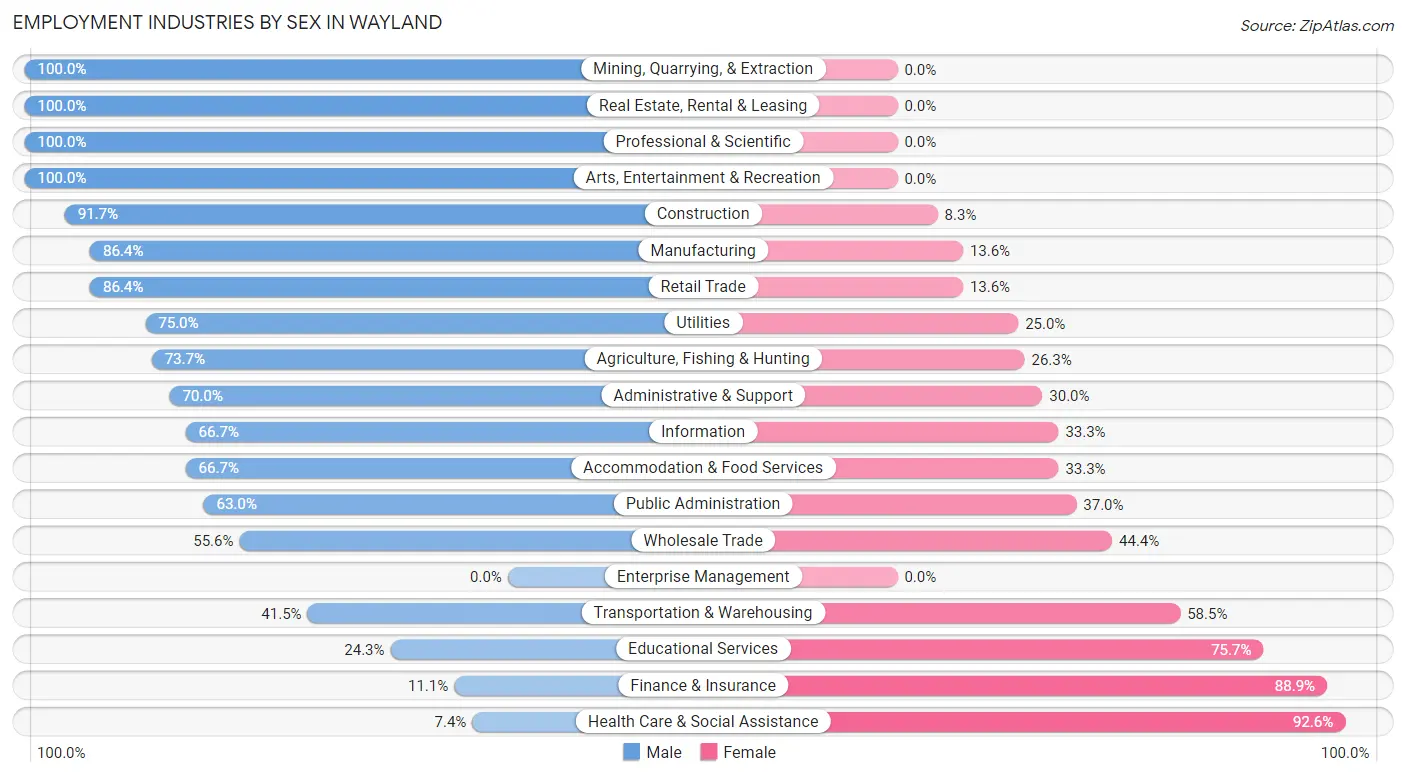
Employment Industries by Sex in Wayland
The Wayland industries that see more men than women are Mining, Quarrying, & Extraction (100.0%), Real Estate, Rental & Leasing (100.0%), and Professional & Scientific (100.0%), whereas the industries that tend to have a higher number of women are Health Care & Social Assistance (92.6%), Finance & Insurance (88.9%), and Educational Services (75.7%).
| Industry | Male | Female |
| Agriculture, Fishing & Hunting | 14 (73.7%) | 5 (26.3%) |
| Mining, Quarrying, & Extraction | 7 (100.0%) | 0 (0.0%) |
| Construction | 44 (91.7%) | 4 (8.3%) |
| Manufacturing | 102 (86.4%) | 16 (13.6%) |
| Wholesale Trade | 5 (55.6%) | 4 (44.4%) |
| Retail Trade | 51 (86.4%) | 8 (13.6%) |
| Transportation & Warehousing | 17 (41.5%) | 24 (58.5%) |
| Utilities | 3 (75.0%) | 1 (25.0%) |
| Information | 10 (66.7%) | 5 (33.3%) |
| Finance & Insurance | 2 (11.1%) | 16 (88.9%) |
| Real Estate, Rental & Leasing | 6 (100.0%) | 0 (0.0%) |
| Professional & Scientific | 9 (100.0%) | 0 (0.0%) |
| Enterprise Management | 0 (0.0%) | 0 (0.0%) |
| Administrative & Support | 7 (70.0%) | 3 (30.0%) |
| Educational Services | 17 (24.3%) | 53 (75.7%) |
| Health Care & Social Assistance | 12 (7.4%) | 151 (92.6%) |
| Arts, Entertainment & Recreation | 12 (100.0%) | 0 (0.0%) |
| Accommodation & Food Services | 18 (66.7%) | 9 (33.3%) |
| Public Administration | 17 (63.0%) | 10 (37.0%) |
| Total | 401 (55.8%) | 317 (44.2%) |
Education in Wayland
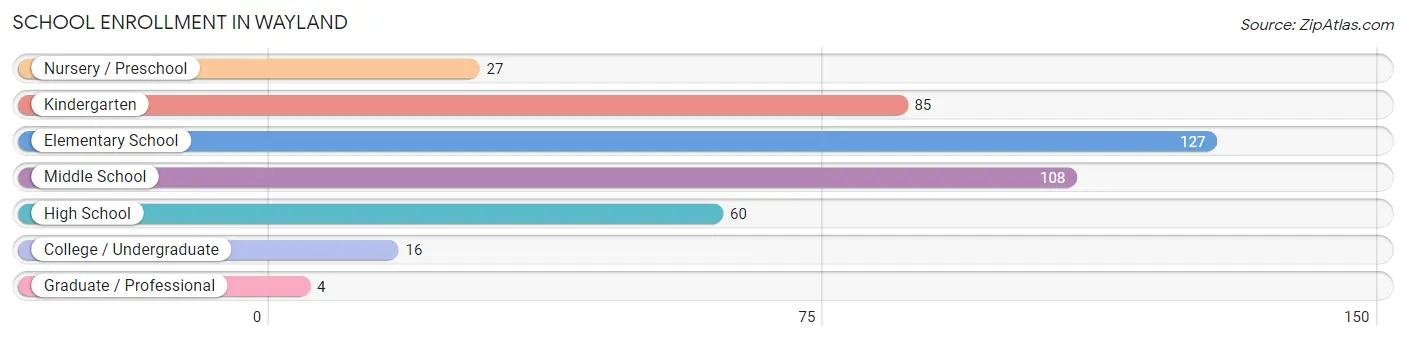
School Enrollment in Wayland
The most common levels of schooling among the 427 students in Wayland are elementary school (127 | 29.7%), middle school (108 | 25.3%), and kindergarten (85 | 19.9%).
| School Level | # Students | % Students |
| Nursery / Preschool | 27 | 6.3% |
| Kindergarten | 85 | 19.9% |
| Elementary School | 127 | 29.7% |
| Middle School | 108 | 25.3% |
| High School | 60 | 14.1% |
| College / Undergraduate | 16 | 3.7% |
| Graduate / Professional | 4 | 0.9% |
| Total | 427 | 100.0% |
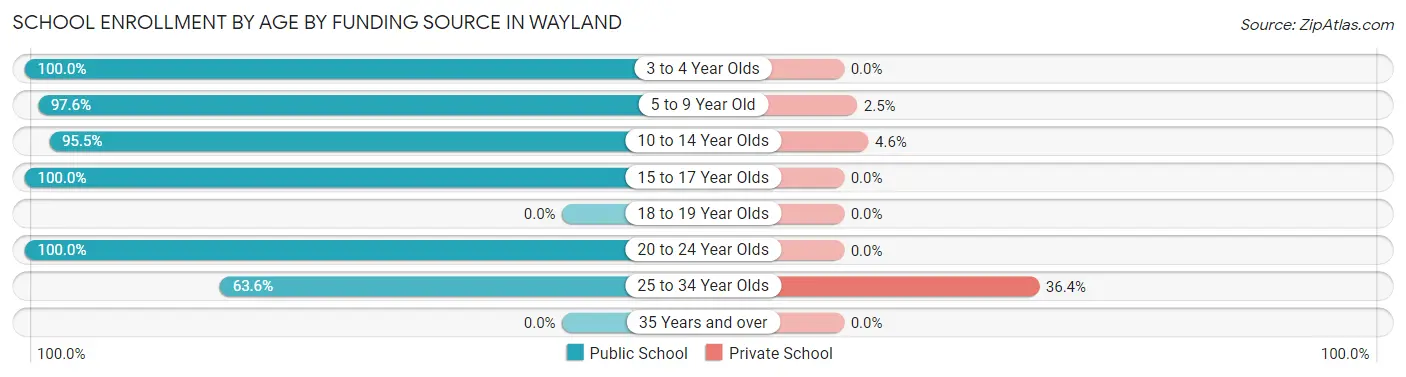
School Enrollment by Age by Funding Source in Wayland
Out of a total of 427 students who are enrolled in schools in Wayland, 16 (3.7%) attend a private institution, while the remaining 411 (96.3%) are enrolled in public schools. The age group of 25 to 34 year olds has the highest likelihood of being enrolled in private schools, with 4 (36.4% in the age bracket) enrolled. Conversely, the age group of 3 to 4 year olds has the lowest likelihood of being enrolled in a private school, with 9 (100.0% in the age bracket) attending a public institution.
| Age Bracket | Public School | Private School |
| 3 to 4 Year Olds | 9 (100.0%) | 0 (0.0%) |
| 5 to 9 Year Old | 159 (97.6%) | 4 (2.5%) |
| 10 to 14 Year Olds | 168 (95.5%) | 8 (4.5%) |
| 15 to 17 Year Olds | 59 (100.0%) | 0 (0.0%) |
| 18 to 19 Year Olds | 0 (0.0%) | 0 (0.0%) |
| 20 to 24 Year Olds | 9 (100.0%) | 0 (0.0%) |
| 25 to 34 Year Olds | 7 (63.6%) | 4 (36.4%) |
| 35 Years and over | 0 (0.0%) | 0 (0.0%) |
| Total | 411 (96.3%) | 16 (3.7%) |
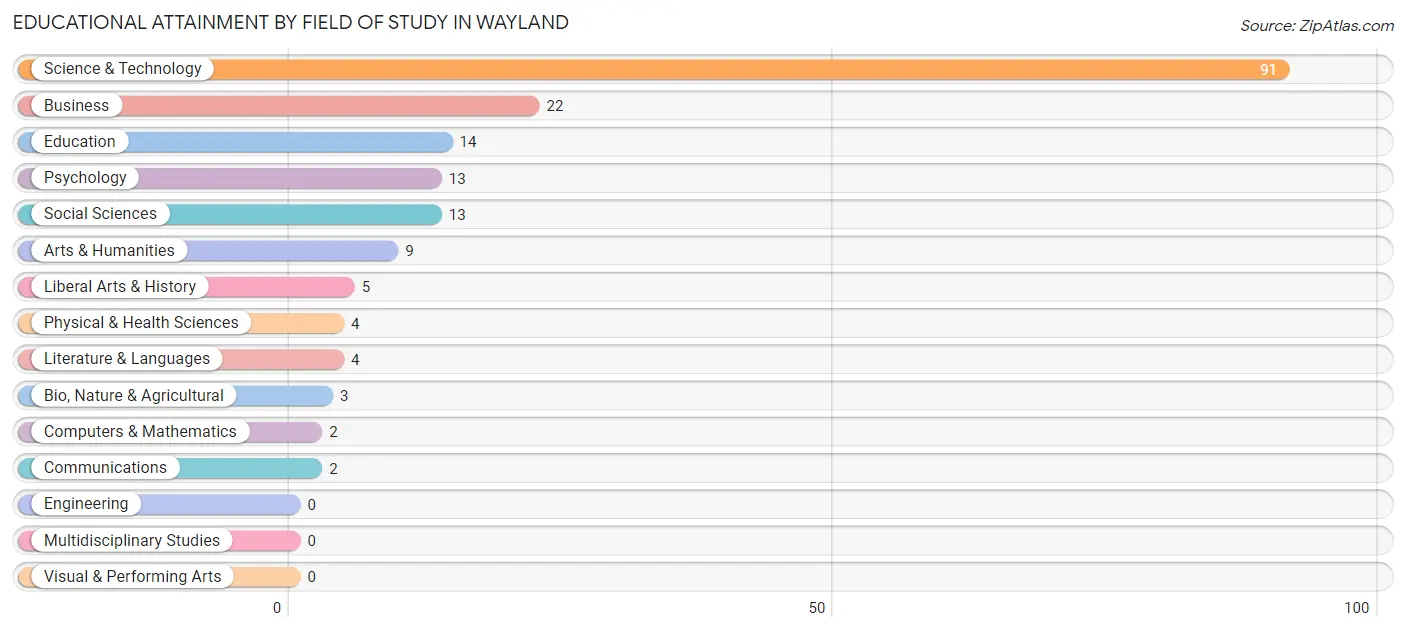
Educational Attainment by Field of Study in Wayland
Science & technology (91 | 50.0%), business (22 | 12.1%), education (14 | 7.7%), psychology (13 | 7.1%), and social sciences (13 | 7.1%) are the most common fields of study among 182 individuals in Wayland who have obtained a bachelor's degree or higher.
| Field of Study | # Graduates | % Graduates |
| Computers & Mathematics | 2 | 1.1% |
| Bio, Nature & Agricultural | 3 | 1.7% |
| Physical & Health Sciences | 4 | 2.2% |
| Psychology | 13 | 7.1% |
| Social Sciences | 13 | 7.1% |
| Engineering | 0 | 0.0% |
| Multidisciplinary Studies | 0 | 0.0% |
| Science & Technology | 91 | 50.0% |
| Business | 22 | 12.1% |
| Education | 14 | 7.7% |
| Literature & Languages | 4 | 2.2% |
| Liberal Arts & History | 5 | 2.8% |
| Visual & Performing Arts | 0 | 0.0% |
| Communications | 2 | 1.1% |
| Arts & Humanities | 9 | 5.0% |
| Total | 182 | 100.0% |
Transportation & Commute in Wayland
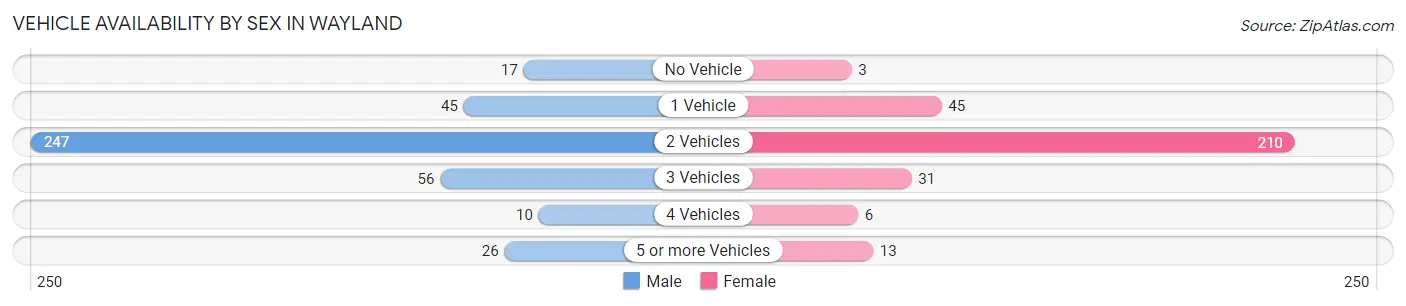
Vehicle Availability by Sex in Wayland
The most prevalent vehicle ownership categories in Wayland are males with 2 vehicles (247, accounting for 61.6%) and females with 2 vehicles (210, making up 80.2%).
| Vehicles Available | Male | Female |
| No Vehicle | 17 (4.2%) | 3 (1.0%) |
| 1 Vehicle | 45 (11.2%) | 45 (14.6%) |
| 2 Vehicles | 247 (61.6%) | 210 (68.2%) |
| 3 Vehicles | 56 (14.0%) | 31 (10.1%) |
| 4 Vehicles | 10 (2.5%) | 6 (1.9%) |
| 5 or more Vehicles | 26 (6.5%) | 13 (4.2%) |
| Total | 401 (100.0%) | 308 (100.0%) |
Commute Time in Wayland
The most frequently occuring commute durations in Wayland are less than 5 minutes (160 commuters, 23.7%), 45 to 59 minutes (97 commuters, 14.4%), and 60 to 89 minutes (86 commuters, 12.7%).
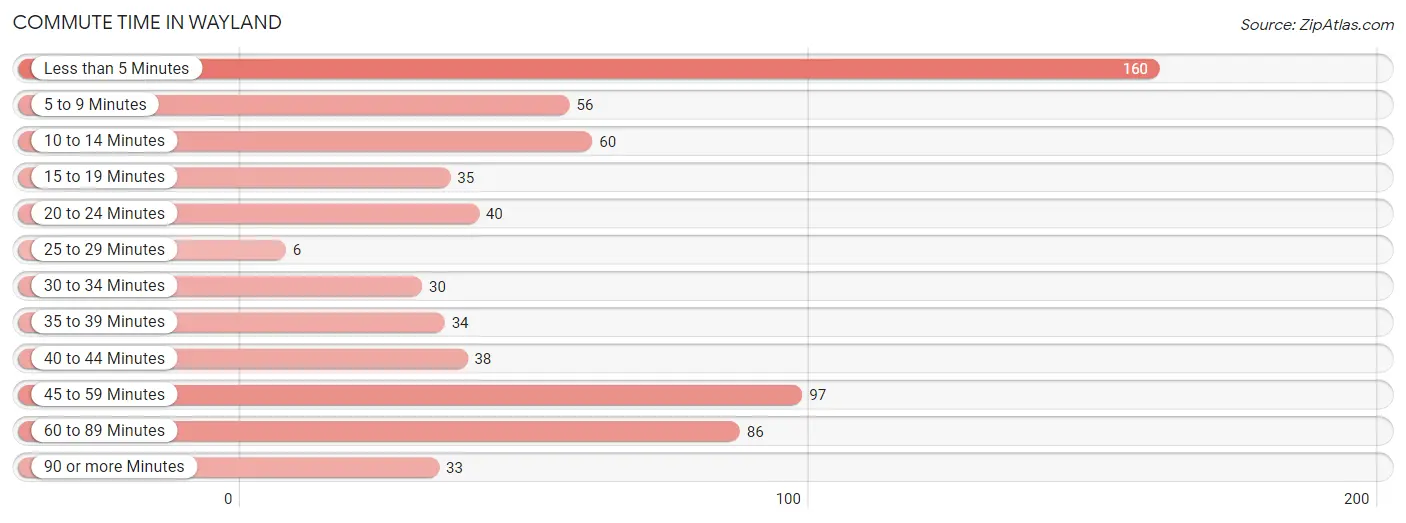
| Commute Time | # Commuters | % Commuters |
| Less than 5 Minutes | 160 | 23.7% |
| 5 to 9 Minutes | 56 | 8.3% |
| 10 to 14 Minutes | 60 | 8.9% |
| 15 to 19 Minutes | 35 | 5.2% |
| 20 to 24 Minutes | 40 | 5.9% |
| 25 to 29 Minutes | 6 | 0.9% |
| 30 to 34 Minutes | 30 | 4.4% |
| 35 to 39 Minutes | 34 | 5.0% |
| 40 to 44 Minutes | 38 | 5.6% |
| 45 to 59 Minutes | 97 | 14.4% |
| 60 to 89 Minutes | 86 | 12.7% |
| 90 or more Minutes | 33 | 4.9% |
Commute Time by Sex in Wayland
The most common commute times in Wayland are less than 5 minutes (84 commuters, 21.3%) for males and less than 5 minutes (76 commuters, 27.1%) for females.
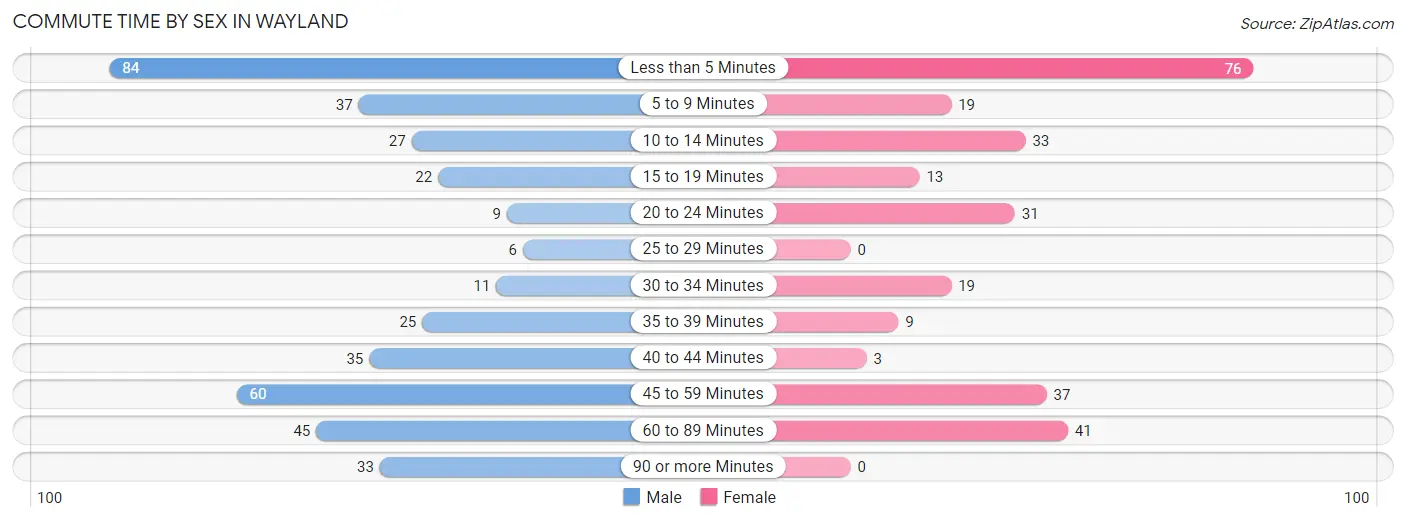
| Commute Time | Male | Female |
| Less than 5 Minutes | 84 (21.3%) | 76 (27.1%) |
| 5 to 9 Minutes | 37 (9.4%) | 19 (6.8%) |
| 10 to 14 Minutes | 27 (6.9%) | 33 (11.7%) |
| 15 to 19 Minutes | 22 (5.6%) | 13 (4.6%) |
| 20 to 24 Minutes | 9 (2.3%) | 31 (11.0%) |
| 25 to 29 Minutes | 6 (1.5%) | 0 (0.0%) |
| 30 to 34 Minutes | 11 (2.8%) | 19 (6.8%) |
| 35 to 39 Minutes | 25 (6.4%) | 9 (3.2%) |
| 40 to 44 Minutes | 35 (8.9%) | 3 (1.1%) |
| 45 to 59 Minutes | 60 (15.2%) | 37 (13.2%) |
| 60 to 89 Minutes | 45 (11.4%) | 41 (14.6%) |
| 90 or more Minutes | 33 (8.4%) | 0 (0.0%) |
Time of Departure to Work by Sex in Wayland
The most frequent times of departure to work in Wayland are 12:00 AM to 4:59 AM (61, 15.5%) for males and 8:00 AM to 8:29 AM (74, 26.3%) for females.
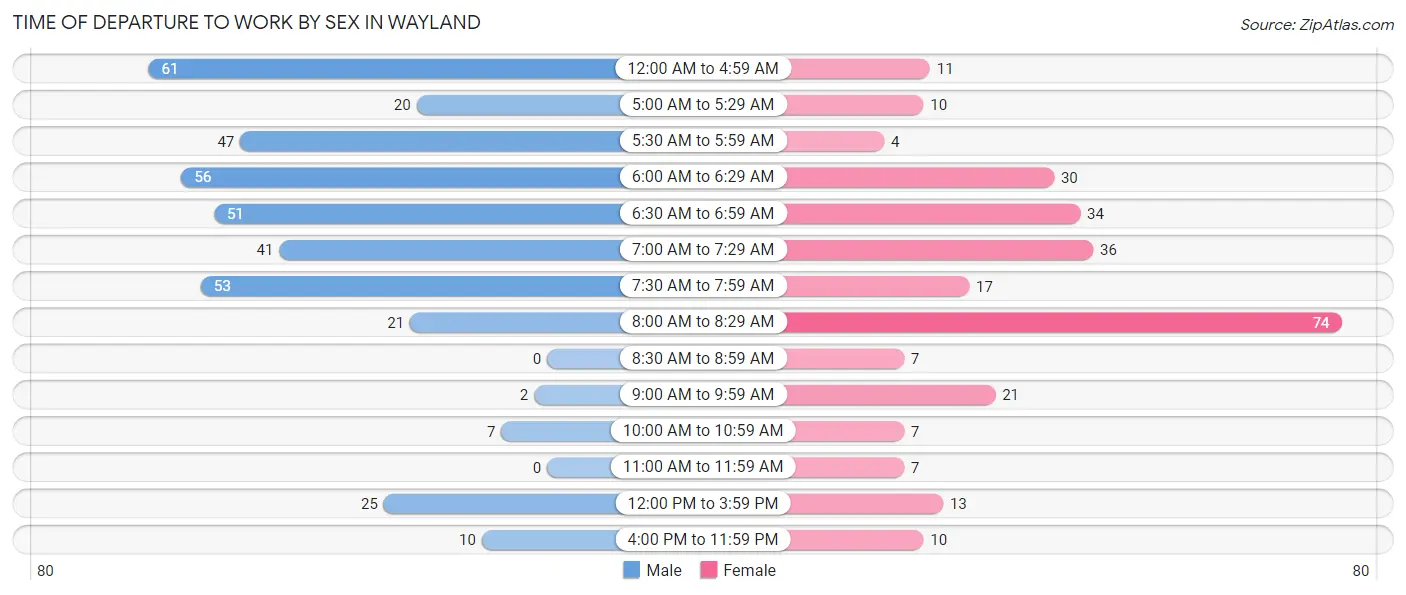
| Time of Departure | Male | Female |
| 12:00 AM to 4:59 AM | 61 (15.5%) | 11 (3.9%) |
| 5:00 AM to 5:29 AM | 20 (5.1%) | 10 (3.6%) |
| 5:30 AM to 5:59 AM | 47 (11.9%) | 4 (1.4%) |
| 6:00 AM to 6:29 AM | 56 (14.2%) | 30 (10.7%) |
| 6:30 AM to 6:59 AM | 51 (12.9%) | 34 (12.1%) |
| 7:00 AM to 7:29 AM | 41 (10.4%) | 36 (12.8%) |
| 7:30 AM to 7:59 AM | 53 (13.5%) | 17 (6.0%) |
| 8:00 AM to 8:29 AM | 21 (5.3%) | 74 (26.3%) |
| 8:30 AM to 8:59 AM | 0 (0.0%) | 7 (2.5%) |
| 9:00 AM to 9:59 AM | 2 (0.5%) | 21 (7.5%) |
| 10:00 AM to 10:59 AM | 7 (1.8%) | 7 (2.5%) |
| 11:00 AM to 11:59 AM | 0 (0.0%) | 7 (2.5%) |
| 12:00 PM to 3:59 PM | 25 (6.4%) | 13 (4.6%) |
| 4:00 PM to 11:59 PM | 10 (2.5%) | 10 (3.6%) |
| Total | 394 (100.0%) | 281 (100.0%) |
Housing Occupancy in Wayland
Occupancy by Ownership in Wayland
Of the total 648 dwellings in Wayland, owner-occupied units account for 494 (76.2%), while renter-occupied units make up 154 (23.8%).
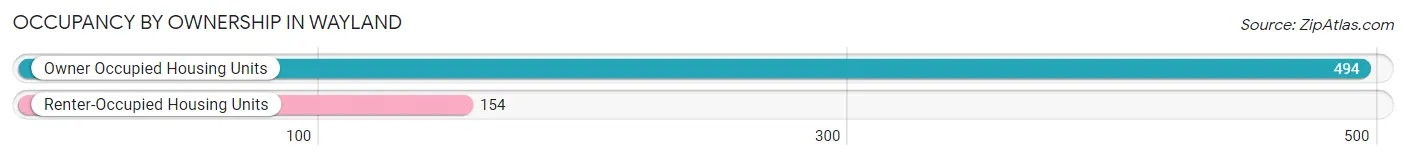
| Occupancy | # Housing Units | % Housing Units |
| Owner Occupied Housing Units | 494 | 76.2% |
| Renter-Occupied Housing Units | 154 | 23.8% |
| Total Occupied Housing Units | 648 | 100.0% |
Occupancy by Household Size in Wayland
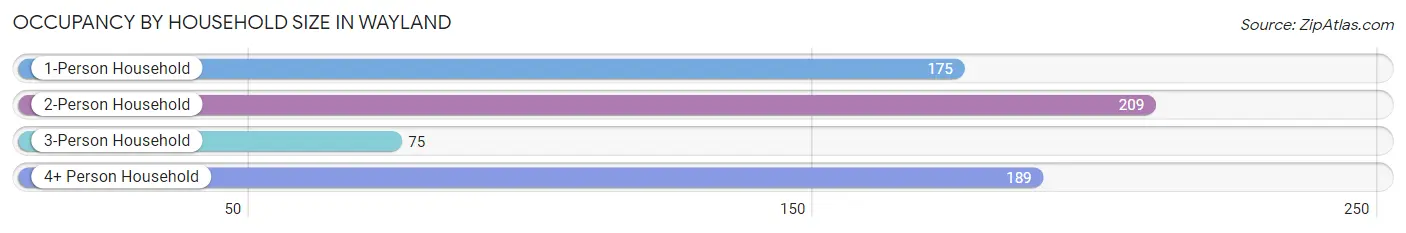
| Household Size | # Housing Units | % Housing Units |
| 1-Person Household | 175 | 27.0% |
| 2-Person Household | 209 | 32.3% |
| 3-Person Household | 75 | 11.6% |
| 4+ Person Household | 189 | 29.2% |
| Total Housing Units | 648 | 100.0% |
Occupancy by Ownership by Household Size in Wayland
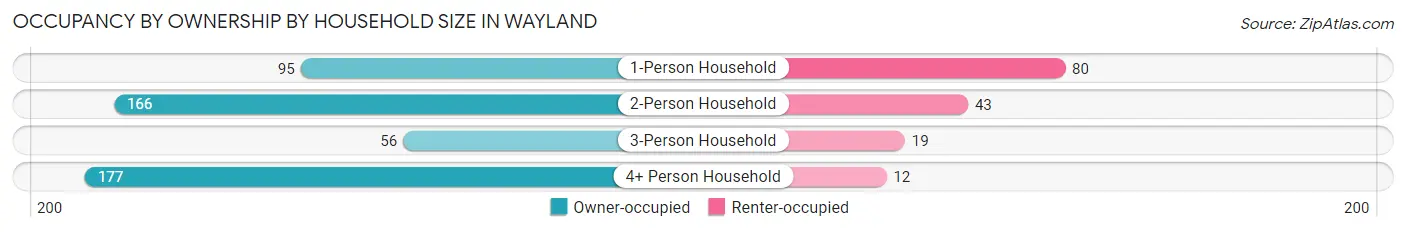
| Household Size | Owner-occupied | Renter-occupied |
| 1-Person Household | 95 (54.3%) | 80 (45.7%) |
| 2-Person Household | 166 (79.4%) | 43 (20.6%) |
| 3-Person Household | 56 (74.7%) | 19 (25.3%) |
| 4+ Person Household | 177 (93.6%) | 12 (6.4%) |
| Total Housing Units | 494 (76.2%) | 154 (23.8%) |
Occupancy by Educational Attainment in Wayland
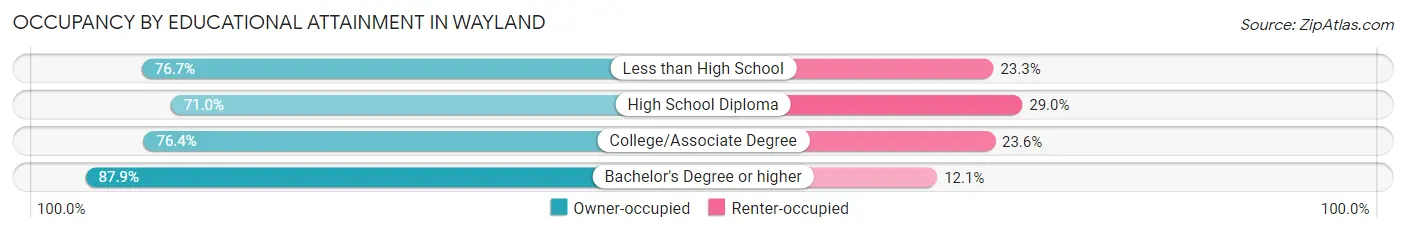
| Household Size | Owner-occupied | Renter-occupied |
| Less than High School | 33 (76.7%) | 10 (23.3%) |
| High School Diploma | 206 (71.0%) | 84 (29.0%) |
| College/Associate Degree | 146 (76.4%) | 45 (23.6%) |
| Bachelor's Degree or higher | 109 (87.9%) | 15 (12.1%) |
Occupancy by Age of Householder in Wayland
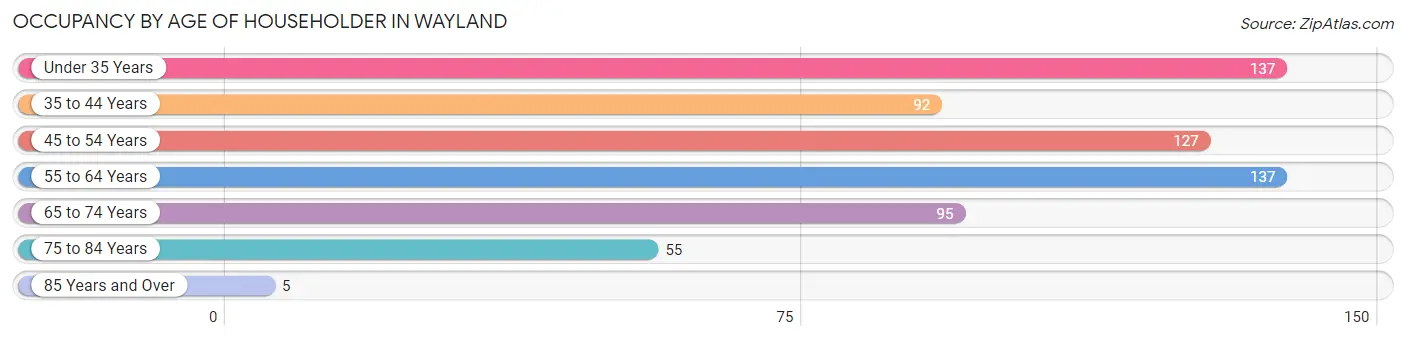
| Age Bracket | # Households | % Households |
| Under 35 Years | 137 | 21.1% |
| 35 to 44 Years | 92 | 14.2% |
| 45 to 54 Years | 127 | 19.6% |
| 55 to 64 Years | 137 | 21.1% |
| 65 to 74 Years | 95 | 14.7% |
| 75 to 84 Years | 55 | 8.5% |
| 85 Years and Over | 5 | 0.8% |
| Total | 648 | 100.0% |
Housing Finances in Wayland
Median Income by Occupancy in Wayland
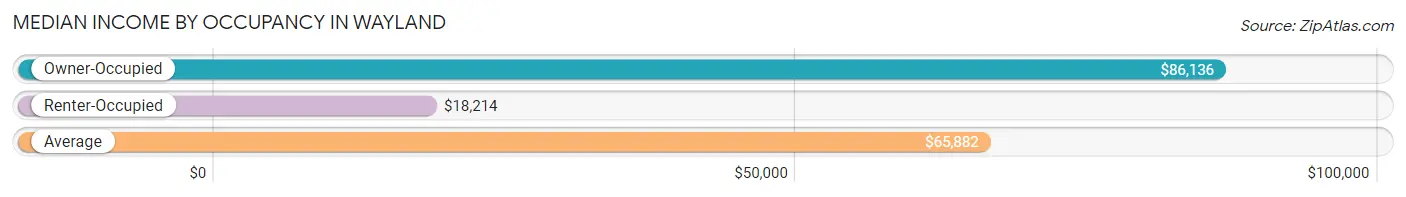
| Occupancy Type | # Households | Median Income |
| Owner-Occupied | 494 (76.2%) | $86,136 |
| Renter-Occupied | 154 (23.8%) | $18,214 |
| Average | 648 (100.0%) | $65,882 |
Occupancy by Householder Income Bracket in Wayland
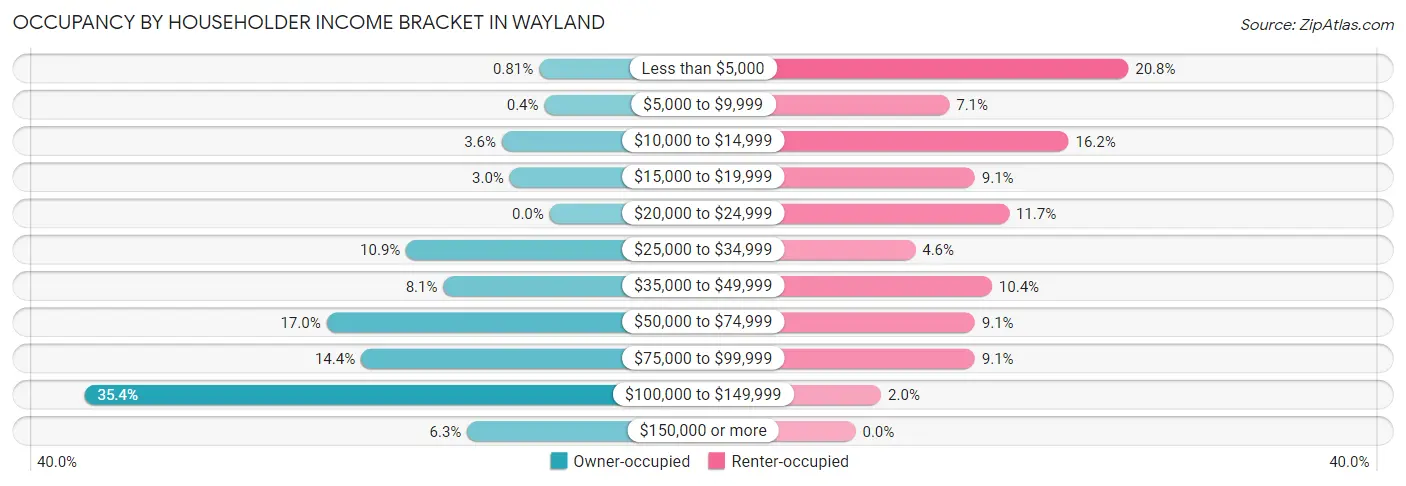
| Income Bracket | Owner-occupied | Renter-occupied |
| Less than $5,000 | 4 (0.8%) | 32 (20.8%) |
| $5,000 to $9,999 | 2 (0.4%) | 11 (7.1%) |
| $10,000 to $14,999 | 18 (3.6%) | 25 (16.2%) |
| $15,000 to $19,999 | 15 (3.0%) | 14 (9.1%) |
| $20,000 to $24,999 | 0 (0.0%) | 18 (11.7%) |
| $25,000 to $34,999 | 54 (10.9%) | 7 (4.5%) |
| $35,000 to $49,999 | 40 (8.1%) | 16 (10.4%) |
| $50,000 to $74,999 | 84 (17.0%) | 14 (9.1%) |
| $75,000 to $99,999 | 71 (14.4%) | 14 (9.1%) |
| $100,000 to $149,999 | 175 (35.4%) | 3 (1.9%) |
| $150,000 or more | 31 (6.3%) | 0 (0.0%) |
| Total | 494 (100.0%) | 154 (100.0%) |
Monthly Housing Cost Tiers in Wayland
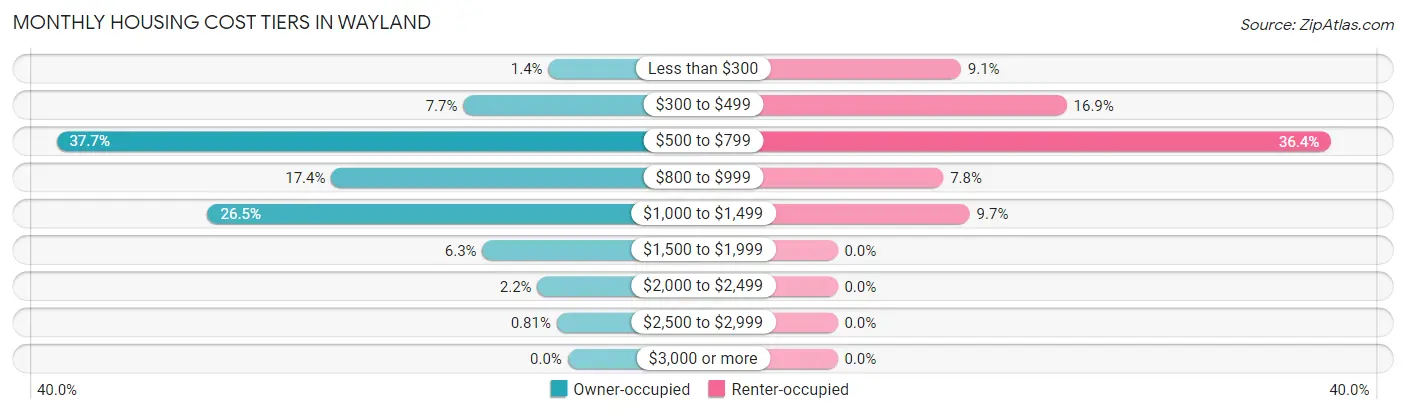
| Monthly Cost | Owner-occupied | Renter-occupied |
| Less than $300 | 7 (1.4%) | 14 (9.1%) |
| $300 to $499 | 38 (7.7%) | 26 (16.9%) |
| $500 to $799 | 186 (37.7%) | 56 (36.4%) |
| $800 to $999 | 86 (17.4%) | 12 (7.8%) |
| $1,000 to $1,499 | 131 (26.5%) | 15 (9.7%) |
| $1,500 to $1,999 | 31 (6.3%) | 0 (0.0%) |
| $2,000 to $2,499 | 11 (2.2%) | 0 (0.0%) |
| $2,500 to $2,999 | 4 (0.8%) | 0 (0.0%) |
| $3,000 or more | 0 (0.0%) | 0 (0.0%) |
| Total | 494 (100.0%) | 154 (100.0%) |
Physical Housing Characteristics in Wayland
Housing Structures in Wayland
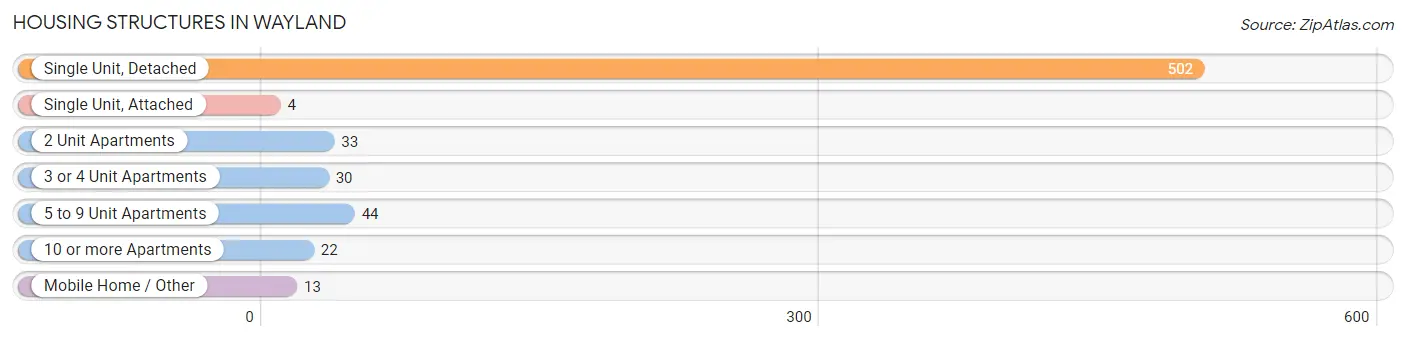
| Structure Type | # Housing Units | % Housing Units |
| Single Unit, Detached | 502 | 77.5% |
| Single Unit, Attached | 4 | 0.6% |
| 2 Unit Apartments | 33 | 5.1% |
| 3 or 4 Unit Apartments | 30 | 4.6% |
| 5 to 9 Unit Apartments | 44 | 6.8% |
| 10 or more Apartments | 22 | 3.4% |
| Mobile Home / Other | 13 | 2.0% |
| Total | 648 | 100.0% |
Housing Structures by Occupancy in Wayland
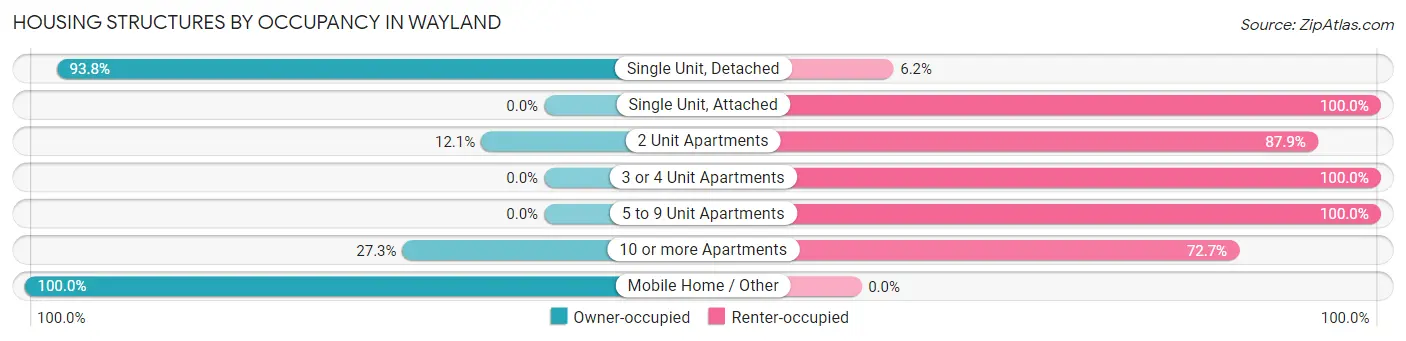
| Structure Type | Owner-occupied | Renter-occupied |
| Single Unit, Detached | 471 (93.8%) | 31 (6.2%) |
| Single Unit, Attached | 0 (0.0%) | 4 (100.0%) |
| 2 Unit Apartments | 4 (12.1%) | 29 (87.9%) |
| 3 or 4 Unit Apartments | 0 (0.0%) | 30 (100.0%) |
| 5 to 9 Unit Apartments | 0 (0.0%) | 44 (100.0%) |
| 10 or more Apartments | 6 (27.3%) | 16 (72.7%) |
| Mobile Home / Other | 13 (100.0%) | 0 (0.0%) |
| Total | 494 (76.2%) | 154 (23.8%) |
Housing Structures by Number of Rooms in Wayland
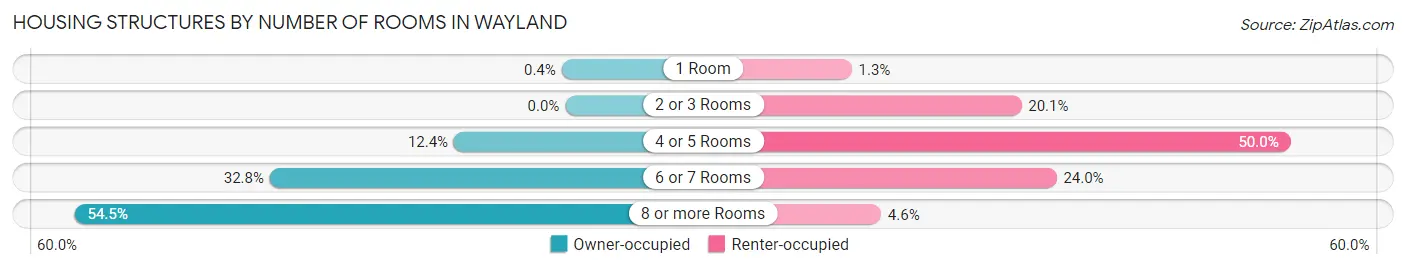
| Number of Rooms | Owner-occupied | Renter-occupied |
| 1 Room | 2 (0.4%) | 2 (1.3%) |
| 2 or 3 Rooms | 0 (0.0%) | 31 (20.1%) |
| 4 or 5 Rooms | 61 (12.3%) | 77 (50.0%) |
| 6 or 7 Rooms | 162 (32.8%) | 37 (24.0%) |
| 8 or more Rooms | 269 (54.4%) | 7 (4.5%) |
| Total | 494 (100.0%) | 154 (100.0%) |
Housing Structure by Heating Type in Wayland
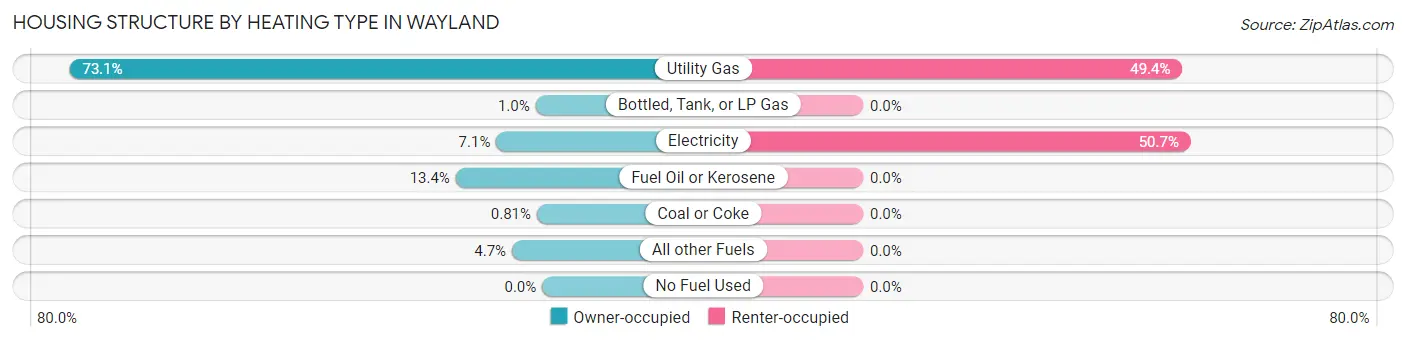
| Heating Type | Owner-occupied | Renter-occupied |
| Utility Gas | 361 (73.1%) | 76 (49.3%) |
| Bottled, Tank, or LP Gas | 5 (1.0%) | 0 (0.0%) |
| Electricity | 35 (7.1%) | 78 (50.6%) |
| Fuel Oil or Kerosene | 66 (13.4%) | 0 (0.0%) |
| Coal or Coke | 4 (0.8%) | 0 (0.0%) |
| All other Fuels | 23 (4.7%) | 0 (0.0%) |
| No Fuel Used | 0 (0.0%) | 0 (0.0%) |
| Total | 494 (100.0%) | 154 (100.0%) |
Household Vehicle Usage in Wayland
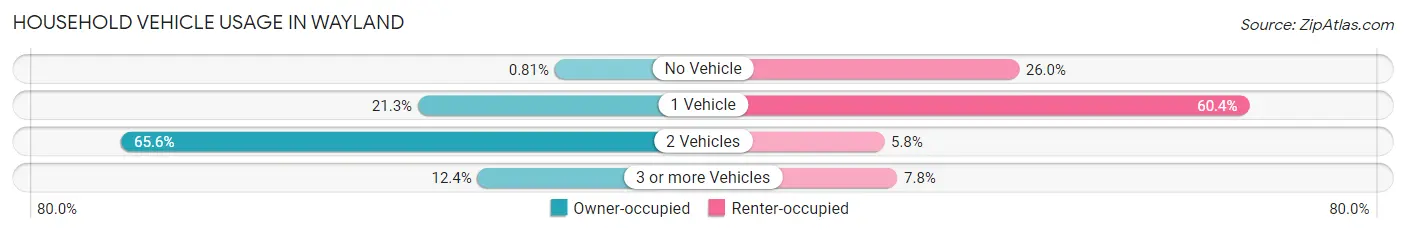
| Vehicles per Household | Owner-occupied | Renter-occupied |
| No Vehicle | 4 (0.8%) | 40 (26.0%) |
| 1 Vehicle | 105 (21.3%) | 93 (60.4%) |
| 2 Vehicles | 324 (65.6%) | 9 (5.8%) |
| 3 or more Vehicles | 61 (12.3%) | 12 (7.8%) |
| Total | 494 (100.0%) | 154 (100.0%) |
Real Estate & Mortgages in Wayland
Real Estate and Mortgage Overview in Wayland
| Characteristic | Without Mortgage | With Mortgage |
| Housing Units | 265 | 229 |
| Median Property Value | $85,000 | $97,300 |
| Median Household Income | $85,536 | $19 |
| Monthly Housing Costs | $667 | $0 |
| Real Estate Taxes | $2,707 | $10 |
Property Value by Mortgage Status in Wayland
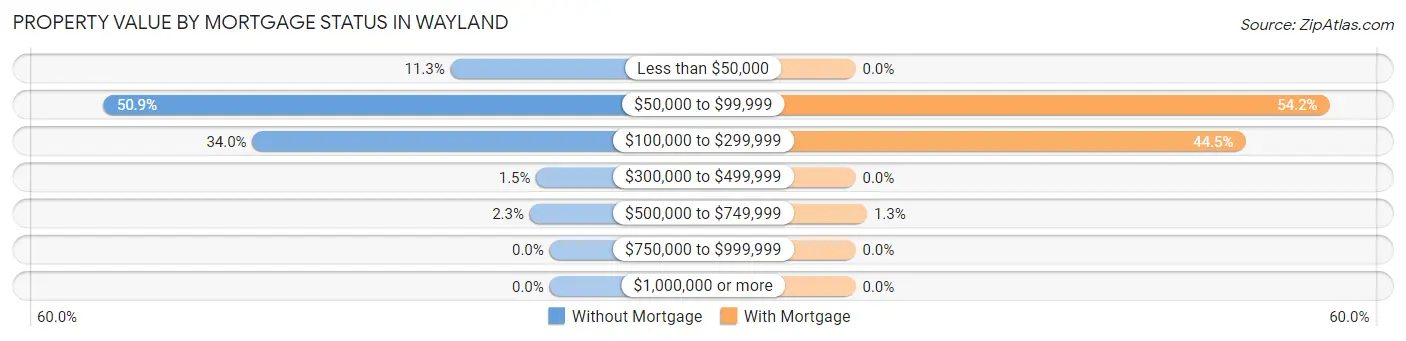
| Property Value | Without Mortgage | With Mortgage |
| Less than $50,000 | 30 (11.3%) | 0 (0.0%) |
| $50,000 to $99,999 | 135 (50.9%) | 124 (54.1%) |
| $100,000 to $299,999 | 90 (34.0%) | 102 (44.5%) |
| $300,000 to $499,999 | 4 (1.5%) | 0 (0.0%) |
| $500,000 to $749,999 | 6 (2.3%) | 3 (1.3%) |
| $750,000 to $999,999 | 0 (0.0%) | 0 (0.0%) |
| $1,000,000 or more | 0 (0.0%) | 0 (0.0%) |
| Total | 265 (100.0%) | 229 (100.0%) |
Household Income by Mortgage Status in Wayland
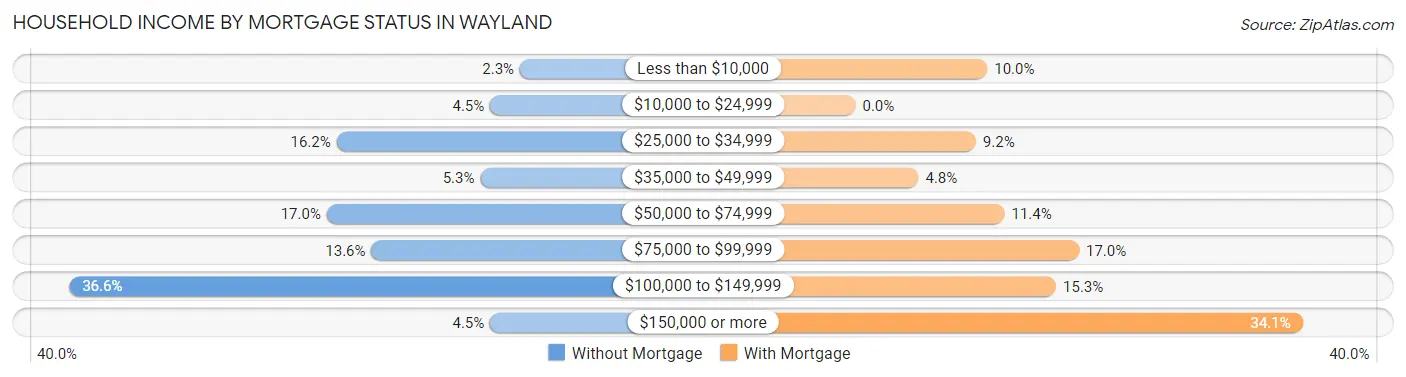
| Household Income | Without Mortgage | With Mortgage |
| Less than $10,000 | 6 (2.3%) | 23 (10.0%) |
| $10,000 to $24,999 | 12 (4.5%) | 0 (0.0%) |
| $25,000 to $34,999 | 43 (16.2%) | 21 (9.2%) |
| $35,000 to $49,999 | 14 (5.3%) | 11 (4.8%) |
| $50,000 to $74,999 | 45 (17.0%) | 26 (11.4%) |
| $75,000 to $99,999 | 36 (13.6%) | 39 (17.0%) |
| $100,000 to $149,999 | 97 (36.6%) | 35 (15.3%) |
| $150,000 or more | 12 (4.5%) | 78 (34.1%) |
| Total | 265 (100.0%) | 229 (100.0%) |
Property Value to Household Income Ratio in Wayland
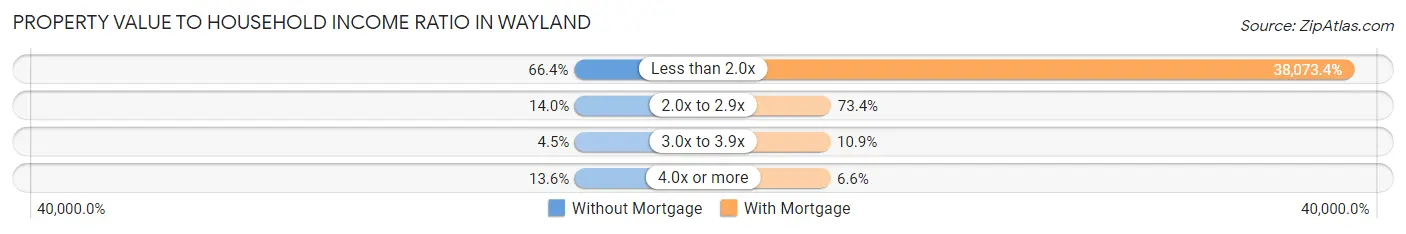
| Value-to-Income Ratio | Without Mortgage | With Mortgage |
| Less than 2.0x | 176 (66.4%) | 87,188 (38,073.4%) |
| 2.0x to 2.9x | 37 (14.0%) | 168 (73.4%) |
| 3.0x to 3.9x | 12 (4.5%) | 25 (10.9%) |
| 4.0x or more | 36 (13.6%) | 15 (6.6%) |
| Total | 265 (100.0%) | 229 (100.0%) |
Real Estate Taxes by Mortgage Status in Wayland
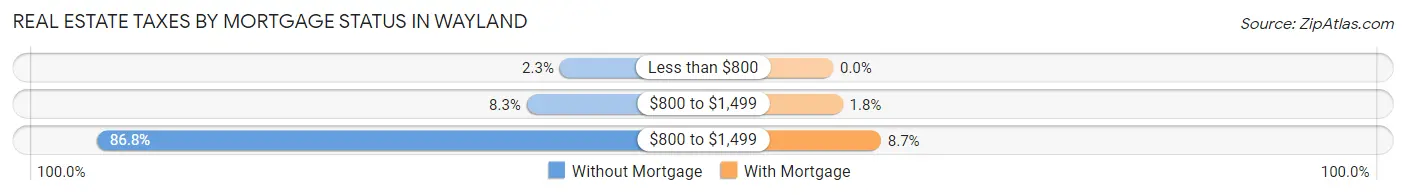
| Property Taxes | Without Mortgage | With Mortgage |
| Less than $800 | 6 (2.3%) | 0 (0.0%) |
| $800 to $1,499 | 22 (8.3%) | 4 (1.8%) |
| $800 to $1,499 | 230 (86.8%) | 20 (8.7%) |
| Total | 265 (100.0%) | 229 (100.0%) |
Health & Disability in Wayland
Health Insurance Coverage by Age in Wayland
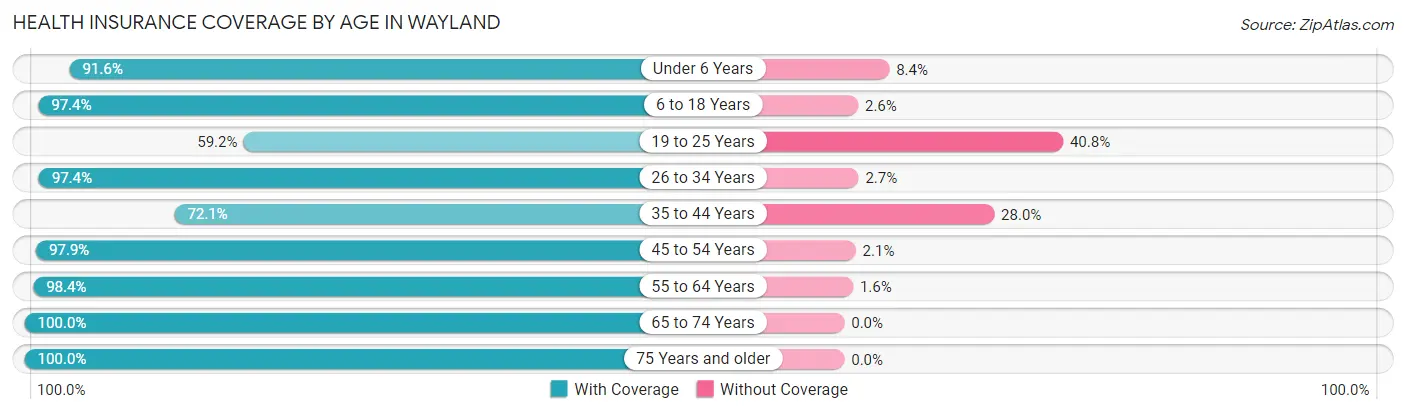
| Age Bracket | With Coverage | Without Coverage |
| Under 6 Years | 153 (91.6%) | 14 (8.4%) |
| 6 to 18 Years | 304 (97.4%) | 8 (2.6%) |
| 19 to 25 Years | 61 (59.2%) | 42 (40.8%) |
| 26 to 34 Years | 184 (97.4%) | 5 (2.6%) |
| 35 to 44 Years | 165 (72.1%) | 64 (28.0%) |
| 45 to 54 Years | 231 (97.9%) | 5 (2.1%) |
| 55 to 64 Years | 244 (98.4%) | 4 (1.6%) |
| 65 to 74 Years | 137 (100.0%) | 0 (0.0%) |
| 75 Years and older | 75 (100.0%) | 0 (0.0%) |
| Total | 1,554 (91.6%) | 142 (8.4%) |
Health Insurance Coverage by Citizenship Status in Wayland
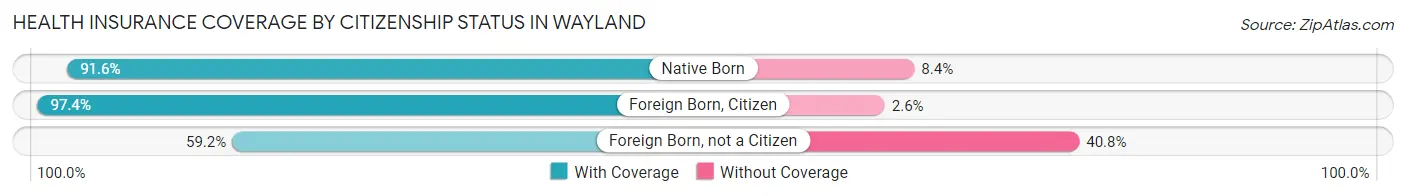
| Citizenship Status | With Coverage | Without Coverage |
| Native Born | 153 (91.6%) | 14 (8.4%) |
| Foreign Born, Citizen | 304 (97.4%) | 8 (2.6%) |
| Foreign Born, not a Citizen | 61 (59.2%) | 42 (40.8%) |
Health Insurance Coverage by Household Income in Wayland
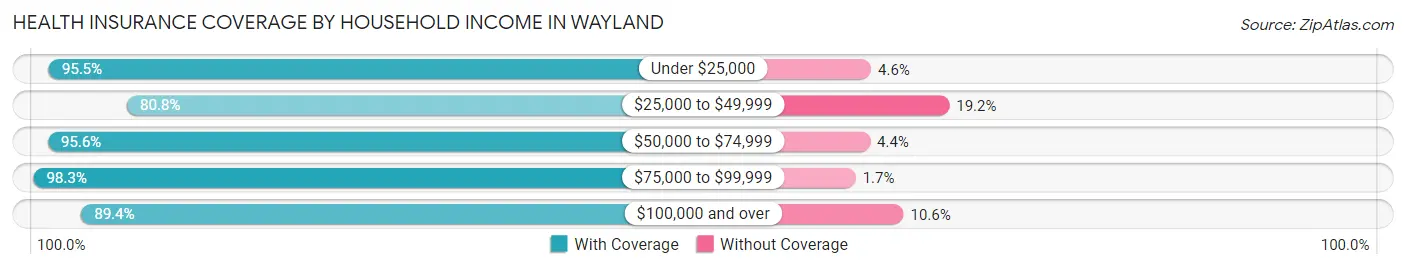
| Household Income | With Coverage | Without Coverage |
| Under $25,000 | 231 (95.5%) | 11 (4.5%) |
| $25,000 to $49,999 | 164 (80.8%) | 39 (19.2%) |
| $50,000 to $74,999 | 219 (95.6%) | 10 (4.4%) |
| $75,000 to $99,999 | 236 (98.3%) | 4 (1.7%) |
| $100,000 and over | 656 (89.4%) | 78 (10.6%) |
Public vs Private Health Insurance Coverage by Age in Wayland
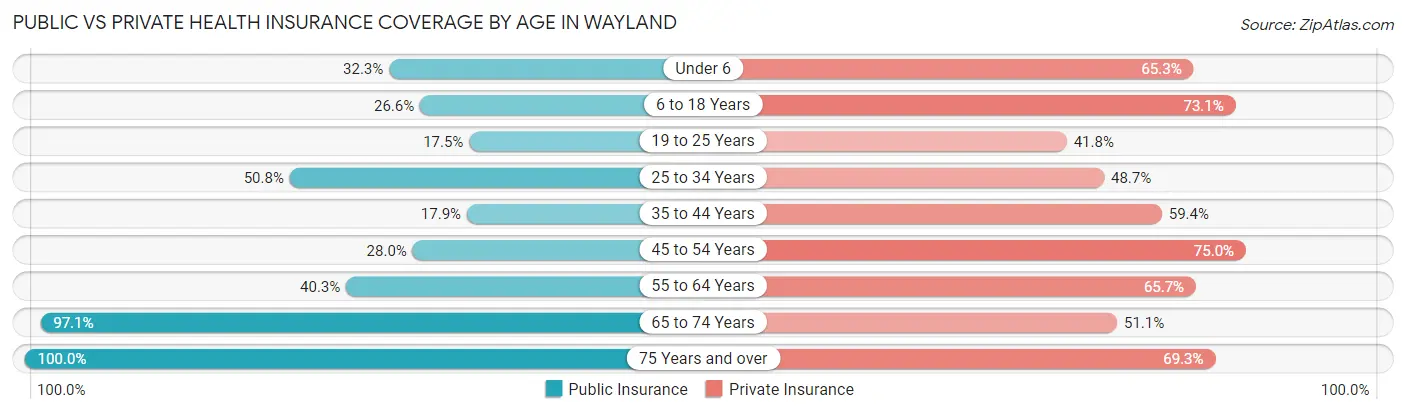
| Age Bracket | Public Insurance | Private Insurance |
| Under 6 | 54 (32.3%) | 109 (65.3%) |
| 6 to 18 Years | 83 (26.6%) | 228 (73.1%) |
| 19 to 25 Years | 18 (17.5%) | 43 (41.7%) |
| 25 to 34 Years | 96 (50.8%) | 92 (48.7%) |
| 35 to 44 Years | 41 (17.9%) | 136 (59.4%) |
| 45 to 54 Years | 66 (28.0%) | 177 (75.0%) |
| 55 to 64 Years | 100 (40.3%) | 163 (65.7%) |
| 65 to 74 Years | 133 (97.1%) | 70 (51.1%) |
| 75 Years and over | 75 (100.0%) | 52 (69.3%) |
| Total | 666 (39.3%) | 1,070 (63.1%) |
Disability Status by Sex by Age in Wayland
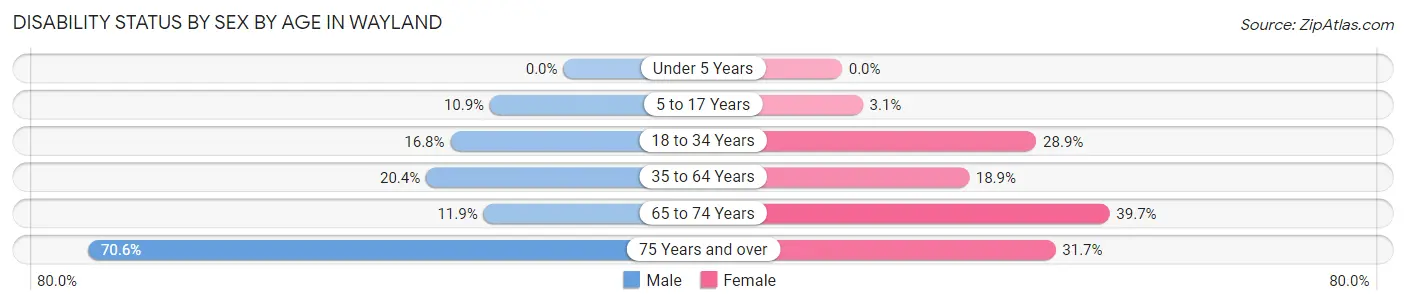
| Age Bracket | Male | Female |
| Under 5 Years | 0 (0.0%) | 0 (0.0%) |
| 5 to 17 Years | 17 (10.9%) | 8 (3.1%) |
| 18 to 34 Years | 24 (16.8%) | 43 (28.9%) |
| 35 to 64 Years | 74 (20.4%) | 66 (18.9%) |
| 65 to 74 Years | 7 (11.9%) | 31 (39.7%) |
| 75 Years and over | 24 (70.6%) | 13 (31.7%) |
Disability Class by Sex by Age in Wayland
Disability Class: Hearing Difficulty
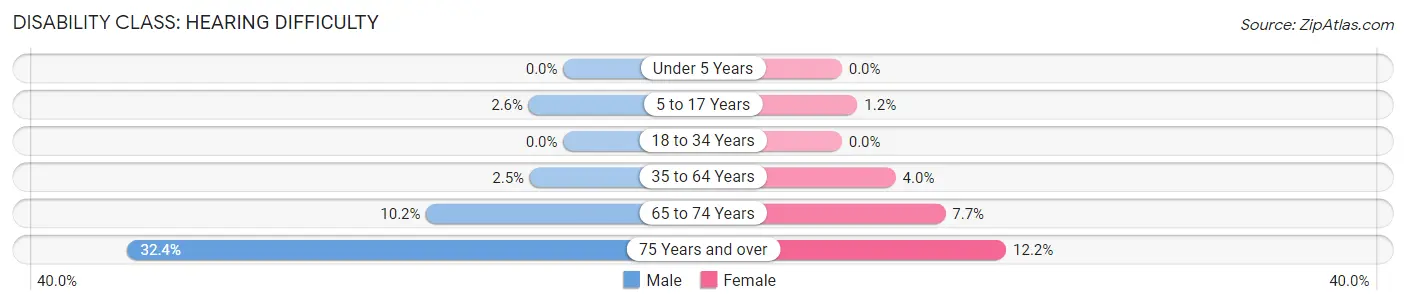
| Age Bracket | Male | Female |
| Under 5 Years | 0 (0.0%) | 0 (0.0%) |
| 5 to 17 Years | 4 (2.6%) | 3 (1.2%) |
| 18 to 34 Years | 0 (0.0%) | 0 (0.0%) |
| 35 to 64 Years | 9 (2.5%) | 14 (4.0%) |
| 65 to 74 Years | 6 (10.2%) | 6 (7.7%) |
| 75 Years and over | 11 (32.4%) | 5 (12.2%) |
Disability Class: Vision Difficulty
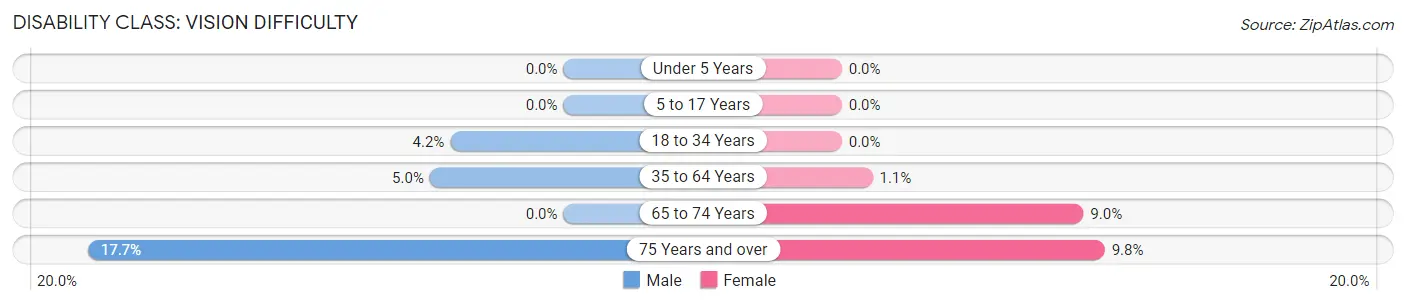
| Age Bracket | Male | Female |
| Under 5 Years | 0 (0.0%) | 0 (0.0%) |
| 5 to 17 Years | 0 (0.0%) | 0 (0.0%) |
| 18 to 34 Years | 6 (4.2%) | 0 (0.0%) |
| 35 to 64 Years | 18 (5.0%) | 4 (1.1%) |
| 65 to 74 Years | 0 (0.0%) | 7 (9.0%) |
| 75 Years and over | 6 (17.6%) | 4 (9.8%) |
Disability Class: Cognitive Difficulty
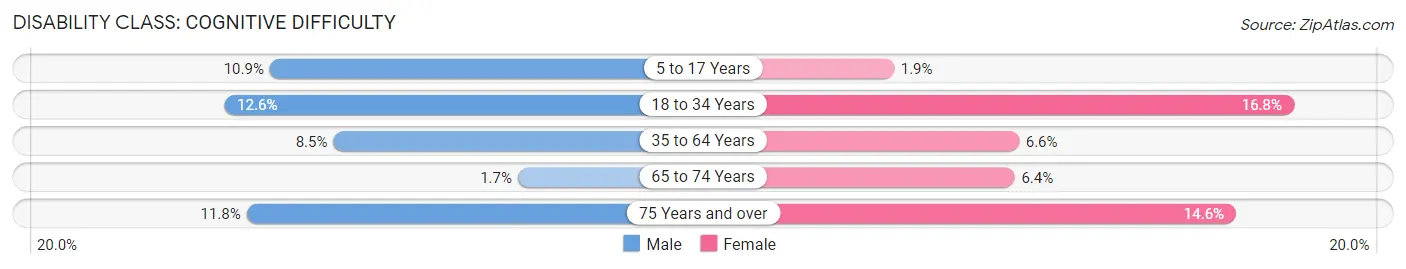
| Age Bracket | Male | Female |
| 5 to 17 Years | 17 (10.9%) | 5 (1.9%) |
| 18 to 34 Years | 18 (12.6%) | 25 (16.8%) |
| 35 to 64 Years | 31 (8.5%) | 23 (6.6%) |
| 65 to 74 Years | 1 (1.7%) | 5 (6.4%) |
| 75 Years and over | 4 (11.8%) | 6 (14.6%) |
Disability Class: Ambulatory Difficulty
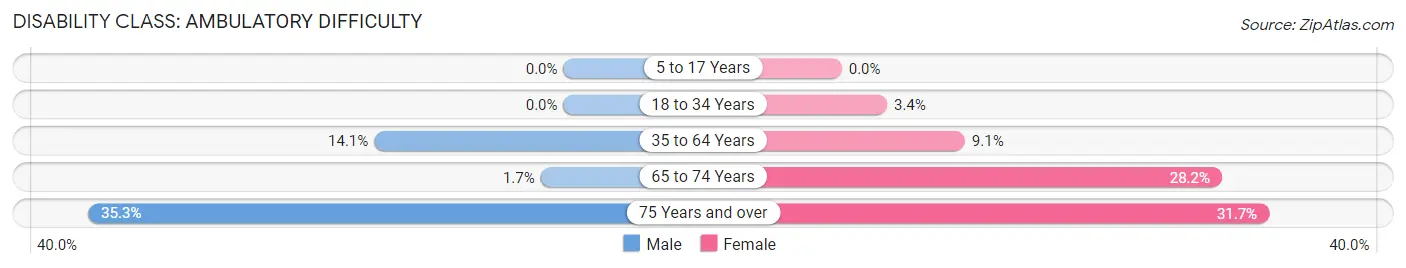
| Age Bracket | Male | Female |
| 5 to 17 Years | 0 (0.0%) | 0 (0.0%) |
| 18 to 34 Years | 0 (0.0%) | 5 (3.4%) |
| 35 to 64 Years | 51 (14.1%) | 32 (9.1%) |
| 65 to 74 Years | 1 (1.7%) | 22 (28.2%) |
| 75 Years and over | 12 (35.3%) | 13 (31.7%) |
Disability Class: Self-Care Difficulty
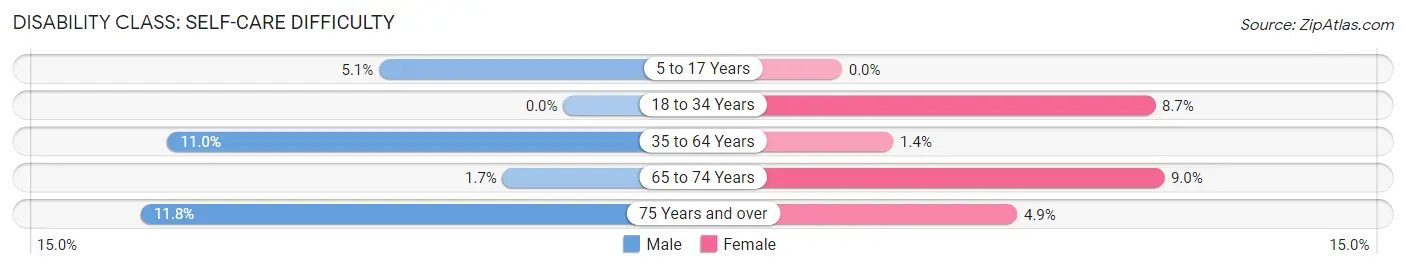
| Age Bracket | Male | Female |
| 5 to 17 Years | 8 (5.1%) | 0 (0.0%) |
| 18 to 34 Years | 0 (0.0%) | 13 (8.7%) |
| 35 to 64 Years | 40 (11.0%) | 5 (1.4%) |
| 65 to 74 Years | 1 (1.7%) | 7 (9.0%) |
| 75 Years and over | 4 (11.8%) | 2 (4.9%) |
Technology Access in Wayland
Computing Device Access in Wayland
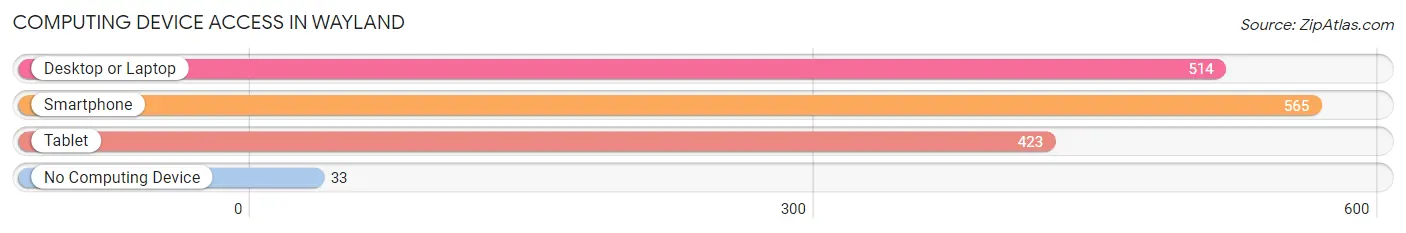
| Device Type | # Households | % Households |
| Desktop or Laptop | 514 | 79.3% |
| Smartphone | 565 | 87.2% |
| Tablet | 423 | 65.3% |
| No Computing Device | 33 | 5.1% |
| Total | 648 | 100.0% |
Internet Access in Wayland
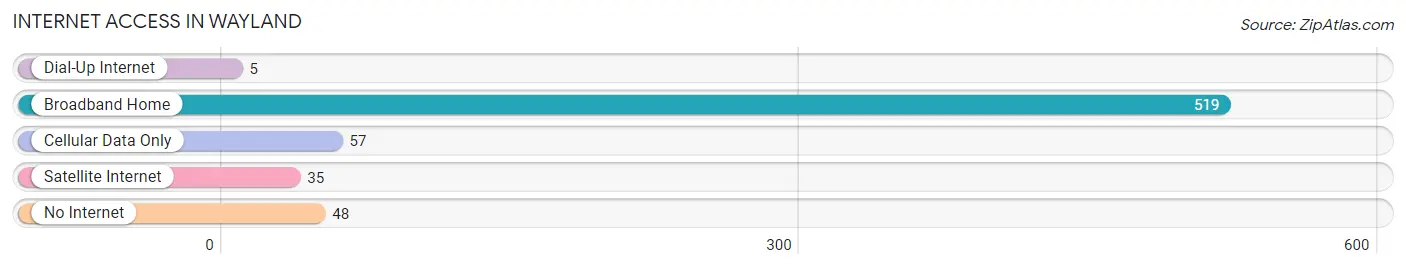
| Internet Type | # Households | % Households |
| Dial-Up Internet | 5 | 0.8% |
| Broadband Home | 519 | 80.1% |
| Cellular Data Only | 57 | 8.8% |
| Satellite Internet | 35 | 5.4% |
| No Internet | 48 | 7.4% |
| Total | 648 | 100.0% |
Wayland Summary
History
The town of Wayland is located in Steuben County, New York, and is part of the Finger Lakes region. The town was first settled in 1790 by a group of settlers from Connecticut, led by Captain John Wayland. The town was officially established in 1817, and was named after Captain Wayland.
The town of Wayland has a rich history of industry and agriculture. In the early 19th century, the town was home to several mills, including a sawmill, gristmill, and a woolen mill. The town was also home to several farms, which produced a variety of crops, including wheat, corn, and potatoes.
In the late 19th century, the town began to experience a period of growth and development. The railroad arrived in 1872, and the town was connected to the larger cities of Rochester and Buffalo. This allowed for the growth of industry and commerce in the area. The town also experienced a population boom, as many people moved to the area to take advantage of the new opportunities.
Geography
The town of Wayland is located in the Finger Lakes region of New York. It is bordered by the towns of Cohocton to the north, Dansville to the east, and Hornellsville to the south. The town is situated on the western edge of the Finger Lakes, and is surrounded by rolling hills and valleys.
The town of Wayland is located in the Genesee River Valley, and is home to several small streams and creeks. The town is also home to several lakes, including Lake Wayland, which is the largest lake in the town.
Economy
The economy of Wayland is largely based on agriculture and tourism. The town is home to several farms, which produce a variety of crops, including wheat, corn, and potatoes. The town is also home to several wineries, which produce a variety of wines.
The town is also home to several businesses, including a variety of retail stores, restaurants, and other services. The town is also home to several manufacturing companies, which produce a variety of products, including furniture, clothing, and electronics.
Demographics
As of the 2010 census, the town of Wayland had a population of 2,845. The population is largely white (96.2%), with a small percentage of African Americans (1.2%), Asians (0.7%), and Native Americans (0.3%). The median household income in the town is $45,945, and the median age is 43.
Conclusion
The town of Wayland is a small town located in the Finger Lakes region of New York. The town has a rich history of industry and agriculture, and is home to several businesses and farms. The town is also home to several wineries, which produce a variety of wines. The town has a population of 2,845, and the median household income is $45,945. The town of Wayland is a great place to live, work, and visit.
Common Questions
What is the Total Population of Wayland?
Total Population of Wayland is 1,696.
What is the Total Male Population of Wayland?
Total Male Population of Wayland is 795.
What is the Total Female Population of Wayland?
Total Female Population of Wayland is 901.
What is the Ratio of Males per 100 Females in Wayland?
There are 88.24 Males per 100 Females in Wayland.
What is the Ratio of Females per 100 Males in Wayland?
There are 113.33 Females per 100 Males in Wayland.
What is the Median Population Age in Wayland?
Median Population Age in Wayland is 37.2 Years.
What is the Average Family Size in Wayland
Average Family Size in Wayland is 2.7 People.
What is the Average Household Size in Wayland
Average Household Size in Wayland is 2.5 People.
What is Per Capita Income in Wayland?
Per Capita income in Wayland is $28,632.
What is the Median Family Income in Wayland?
Median Family Income in Wayland is $85,766.
What is the Median Household income in Wayland?
Median Household Income in Wayland is $65,882.
What is Income or Wage Gap in Wayland?
Income or Wage Gap in Wayland is 17.5%.
Women in Wayland earn 82.5 cents for every dollar earned by a man.
What is Family Income Deficit in Wayland?
Family Income Deficit in Wayland is $11,597.
Families that are below poverty line in Wayland earn $11,597 less on average than the poverty threshold level.
What is Inequality or Gini Index in Wayland?
Inequality or Gini Index in Wayland is 0.40.
How Large is the Labor Force in Wayland?
There are 757 People in the Labor Forcein in Wayland.
What is the Percentage of People in the Labor Force in Wayland?
59.9% of People are in the Labor Force in Wayland.
What is the Unemployment Rate in Wayland?
Unemployment Rate in Wayland is 5.0%.