Cities with the Highest Percentage of Black / African American Population in New York
RELATED REPORTS & OPTIONS
Black / African American
New York
Compare Cities
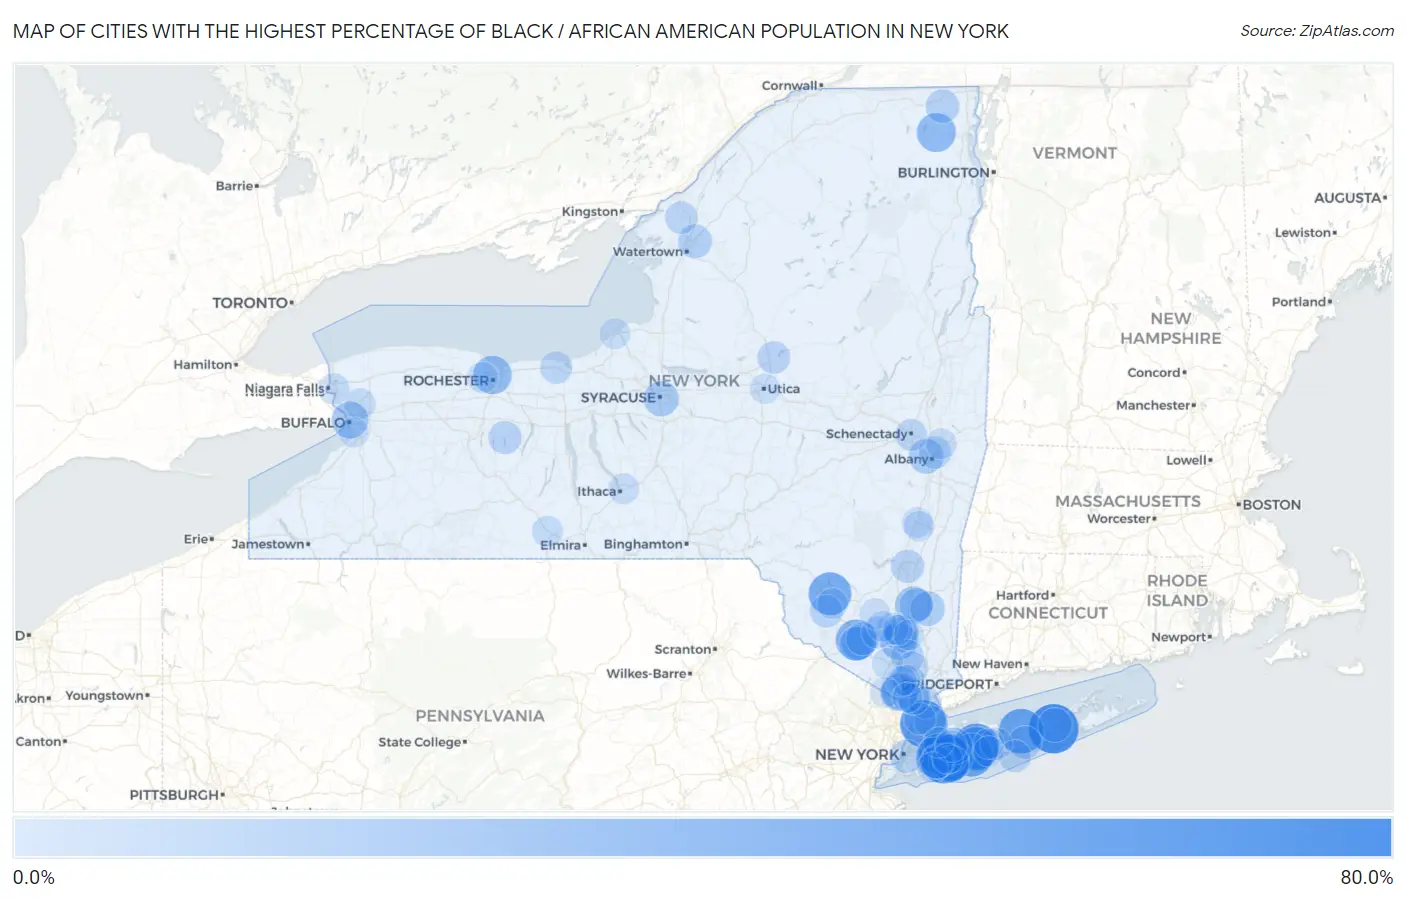
Map of Cities with the Highest Percentage of Black / African American Population in New York
0.0%
80.0%
Cities with the Highest Percentage of Black / African American Population in New York
| City | Black / African American | vs State | vs National | |
| 1. | Northampton | 69.1% | 15.1%(+54.1)#1 | 12.5%(+56.6)#642 |
| 2. | Lakeview | 68.1% | 15.1%(+53.0)#2 | 12.5%(+55.6)#668 |
| 3. | Mount Vernon | 62.4% | 15.1%(+47.4)#3 | 12.5%(+50.0)#819 |
| 4. | Wheatley Heights | 57.4% | 15.1%(+42.3)#4 | 12.5%(+44.9)#990 |
| 5. | Fairview Cdp Westchester County | 57.1% | 15.1%(+42.0)#5 | 12.5%(+44.6)#997 |
| 6. | Gordon Heights | 56.1% | 15.1%(+41.0)#6 | 12.5%(+43.6)#1,032 |
| 7. | Wyandanch | 53.0% | 15.1%(+37.9)#7 | 12.5%(+40.5)#1,143 |
| 8. | North Amityville | 51.7% | 15.1%(+36.7)#8 | 12.5%(+39.3)#1,178 |
| 9. | North Valley Stream | 50.0% | 15.1%(+35.0)#9 | 12.5%(+37.6)#1,252 |
| 10. | Roosevelt | 50.0% | 15.1%(+34.9)#10 | 12.5%(+37.5)#1,255 |
| 11. | Loch Sheldrake | 49.9% | 15.1%(+34.8)#11 | 12.5%(+37.4)#1,259 |
| 12. | Hempstead | 46.9% | 15.1%(+31.9)#12 | 12.5%(+34.5)#1,381 |
| 13. | Washington Heights | 45.1% | 15.1%(+30.0)#13 | 12.5%(+32.6)#1,467 |
| 14. | Elmont | 44.3% | 15.1%(+29.3)#14 | 12.5%(+31.9)#1,505 |
| 15. | South Floral Park | 43.9% | 15.1%(+28.8)#15 | 12.5%(+31.4)#1,530 |
| 16. | Baldwin | 42.6% | 15.1%(+27.6)#16 | 12.5%(+30.1)#1,600 |
| 17. | Dannemora | 39.5% | 15.1%(+24.4)#17 | 12.5%(+27.0)#1,774 |
| 18. | Rochester | 37.9% | 15.1%(+22.8)#18 | 12.5%(+25.4)#1,859 |
| 19. | Kiamesha Lake | 37.7% | 15.1%(+22.6)#19 | 12.5%(+25.2)#1,869 |
| 20. | Uniondale | 36.3% | 15.1%(+21.3)#20 | 12.5%(+23.9)#1,953 |
| 21. | New Cassel | 34.3% | 15.1%(+19.2)#21 | 12.5%(+21.8)#2,067 |
| 22. | Poughkeepsie | 33.9% | 15.1%(+18.8)#22 | 12.5%(+21.4)#2,095 |
| 23. | Vails Gate | 33.3% | 15.1%(+18.2)#23 | 12.5%(+20.8)#2,127 |
| 24. | Buffalo | 33.2% | 15.1%(+18.2)#24 | 12.5%(+20.8)#2,131 |
| 25. | Hillcrest | 33.2% | 15.1%(+18.1)#25 | 12.5%(+20.7)#2,134 |
| 26. | Spring Valley | 32.1% | 15.1%(+17.1)#26 | 12.5%(+19.7)#2,205 |
| 27. | Freeport | 31.5% | 15.1%(+16.5)#27 | 12.5%(+19.1)#2,239 |
| 28. | Fallsburg | 29.4% | 15.1%(+14.3)#28 | 12.5%(+16.9)#2,405 |
| 29. | Syracuse | 29.0% | 15.1%(+14.0)#29 | 12.5%(+16.5)#2,428 |
| 30. | Chelsea Cove | 28.4% | 15.1%(+13.3)#30 | 12.5%(+15.9)#2,480 |
| 31. | Albany | 27.9% | 15.1%(+12.8)#31 | 12.5%(+15.4)#2,515 |
| 32. | Freedom Plains | 27.0% | 15.1%(+11.9)#32 | 12.5%(+14.5)#2,573 |
| 33. | Mechanicstown | 26.5% | 15.1%(+11.5)#33 | 12.5%(+14.0)#2,607 |
| 34. | Nyack | 26.2% | 15.1%(+11.1)#34 | 12.5%(+13.7)#2,634 |
| 35. | Swan Lake | 26.1% | 15.1%(+11.0)#35 | 12.5%(+13.6)#2,643 |
| 36. | Valley Stream | 26.1% | 15.1%(+11.0)#36 | 12.5%(+13.6)#2,651 |
| 37. | Mongaup Valley | 25.9% | 15.1%(+10.9)#37 | 12.5%(+13.5)#2,664 |
| 38. | Wingdale | 25.8% | 15.1%(+10.7)#38 | 12.5%(+13.3)#2,682 |
| 39. | Newburgh | 25.7% | 15.1%(+10.6)#39 | 12.5%(+13.2)#2,690 |
| 40. | Riverside | 25.5% | 15.1%(+10.4)#40 | 12.5%(+13.0)#2,710 |
| 41. | Middletown | 25.5% | 15.1%(+10.4)#41 | 12.5%(+13.0)#2,717 |
| 42. | Calcium | 25.1% | 15.1%(+10.1)#42 | 12.5%(+12.7)#2,751 |
| 43. | Balmville | 24.9% | 15.1%(+9.83)#43 | 12.5%(+12.4)#2,772 |
| 44. | Arlington | 24.5% | 15.1%(+9.47)#44 | 12.5%(+12.1)#2,802 |
| 45. | Altona | 24.2% | 15.1%(+9.14)#45 | 12.5%(+11.7)#2,837 |
| 46. | East Kingston | 23.6% | 15.1%(+8.56)#46 | 12.5%(+11.1)#2,890 |
| 47. | East Durham | 23.5% | 15.1%(+8.46)#47 | 12.5%(+11.1)#2,903 |
| 48. | Honeoye | 23.2% | 15.1%(+8.12)#48 | 12.5%(+10.7)#2,944 |
| 49. | North Bellport | 23.2% | 15.1%(+8.10)#49 | 12.5%(+10.7)#2,946 |
| 50. | New York | 23.1% | 15.1%(+8.04)#50 | 12.5%(+10.6)#2,955 |
| 51. | Scotchtown | 22.6% | 15.1%(+7.52)#51 | 12.5%(+10.1)#3,013 |
| 52. | Prospect | 22.2% | 15.1%(+7.12)#52 | 12.5%(+9.71)#3,057 |
| 53. | Highland Falls | 22.1% | 15.1%(+7.06)#53 | 12.5%(+9.65)#3,063 |
| 54. | Monticello | 21.9% | 15.1%(+6.88)#54 | 12.5%(+9.47)#3,079 |
| 55. | La Fargeville | 21.7% | 15.1%(+6.64)#55 | 12.5%(+9.23)#3,100 |
| 56. | South Valley Stream | 21.7% | 15.1%(+6.61)#56 | 12.5%(+9.20)#3,103 |
| 57. | Menands | 21.5% | 15.1%(+6.48)#57 | 12.5%(+9.07)#3,122 |
| 58. | Fairview Cdp Dutchess County | 21.5% | 15.1%(+6.46)#58 | 12.5%(+9.05)#3,125 |
| 59. | Haverstraw | 20.9% | 15.1%(+5.88)#59 | 12.5%(+8.47)#3,189 |
| 60. | Sodus | 20.9% | 15.1%(+5.86)#60 | 12.5%(+8.45)#3,195 |
| 61. | Fire Island | 20.8% | 15.1%(+5.75)#61 | 12.5%(+8.34)#3,208 |
| 62. | Elmsford | 20.7% | 15.1%(+5.66)#62 | 12.5%(+8.25)#3,218 |
| 63. | Schenectady | 20.2% | 15.1%(+5.12)#63 | 12.5%(+7.71)#3,288 |
| 64. | Central Islip | 20.1% | 15.1%(+5.04)#64 | 12.5%(+7.63)#3,299 |
| 65. | Orange Lake | 20.1% | 15.1%(+5.03)#65 | 12.5%(+7.62)#3,300 |
| 66. | Peekskill | 20.0% | 15.1%(+4.91)#66 | 12.5%(+7.50)#3,315 |
| 67. | Montgomery | 19.6% | 15.1%(+4.53)#67 | 12.5%(+7.12)#3,351 |
| 68. | New Rochelle | 19.3% | 15.1%(+4.21)#68 | 12.5%(+6.80)#3,393 |
| 69. | Westbury | 18.9% | 15.1%(+3.86)#69 | 12.5%(+6.45)#3,433 |
| 70. | South Nyack | 18.8% | 15.1%(+3.74)#70 | 12.5%(+6.33)#3,454 |
| 71. | Yonkers | 18.7% | 15.1%(+3.61)#71 | 12.5%(+6.20)#3,473 |
| 72. | Woodbourne | 18.6% | 15.1%(+3.53)#72 | 12.5%(+6.12)#3,488 |
| 73. | University At Buffalo | 18.0% | 15.1%(+2.96)#73 | 12.5%(+5.55)#3,579 |
| 74. | Harriman | 17.9% | 15.1%(+2.84)#74 | 12.5%(+5.43)#3,594 |
| 75. | Niagara Falls | 17.9% | 15.1%(+2.81)#75 | 12.5%(+5.40)#3,599 |
| 76. | Coopers Plains | 17.4% | 15.1%(+2.30)#76 | 12.5%(+4.89)#3,664 |
| 77. | Forest Home | 17.3% | 15.1%(+2.19)#77 | 12.5%(+4.78)#3,681 |
| 78. | Schuyler Lake | 17.1% | 15.1%(+2.01)#78 | 12.5%(+4.60)#3,723 |
| 79. | Watchtower | 17.1% | 15.1%(+2.00)#79 | 12.5%(+4.59)#3,724 |
| 80. | North Gates | 17.1% | 15.1%(+1.99)#80 | 12.5%(+4.58)#3,727 |
| 81. | South Fallsburg | 17.0% | 15.1%(+1.97)#81 | 12.5%(+4.56)#3,735 |
| 82. | Jefferson Heights | 17.0% | 15.1%(+1.94)#82 | 12.5%(+4.53)#3,741 |
| 83. | Troy | 16.8% | 15.1%(+1.74)#83 | 12.5%(+4.33)#3,768 |
| 84. | Suny Oswego | 16.7% | 15.1%(+1.69)#84 | 12.5%(+4.28)#3,772 |
| 85. | West Haverstraw | 16.7% | 15.1%(+1.60)#85 | 12.5%(+4.19)#3,790 |
| 86. | Walden | 16.6% | 15.1%(+1.57)#86 | 12.5%(+4.16)#3,793 |
| 87. | Utica | 16.2% | 15.1%(+1.17)#87 | 12.5%(+3.76)#3,867 |
| 88. | Inwood | 16.0% | 15.1%(+0.941)#88 | 12.5%(+3.53)#3,911 |
| 89. | Mount Ivy | 15.9% | 15.1%(+0.878)#89 | 12.5%(+3.47)#3,923 |
| 90. | Manhasset | 15.9% | 15.1%(+0.821)#90 | 12.5%(+3.41)#3,933 |
| 91. | Brentwood | 15.8% | 15.1%(+0.741)#91 | 12.5%(+3.33)#3,941 |
| 92. | Catskill | 15.8% | 15.1%(+0.710)#92 | 12.5%(+3.30)#3,951 |
| 93. | Beacon | 15.6% | 15.1%(+0.535)#93 | 12.5%(+3.13)#3,981 |
| 94. | Hillburn | 15.6% | 15.1%(+0.502)#94 | 12.5%(+3.09)#3,987 |
| 95. | South Hempstead | 15.4% | 15.1%(+0.315)#95 | 12.5%(+2.90)#4,022 |
| 96. | Bay Shore | 15.4% | 15.1%(+0.300)#96 | 12.5%(+2.89)#4,025 |
| 97. | Lackawanna | 15.3% | 15.1%(+0.227)#97 | 12.5%(+2.82)#4,039 |
| 98. | West Nyack | 15.2% | 15.1%(+0.147)#98 | 12.5%(+2.74)#4,057 |
| 99. | Gardnertown | 15.1% | 15.1%(+0.081)#99 | 12.5%(+2.67)#4,069 |
| 100. | Niagara University | 15.1% | 15.1%(+0.047)#100 | 12.5%(+2.64)#4,077 |
Common Questions
What are the Top 10 Cities with the Highest Percentage of Black / African American Population in New York?
Top 10 Cities with the Highest Percentage of Black / African American Population in New York are:
#1
69.1%
#2
68.1%
#3
62.4%
#4
57.4%
#5
56.1%
#6
53.0%
#7
51.7%
#8
50.0%
#9
50.0%
#10
49.9%
What city has the Highest Percentage of Black / African American Population in New York?
Northampton has the Highest Percentage of Black / African American Population in New York with 69.1%.
What is the Percentage of Black / African American Population in the State of New York?
Percentage of Black / African American Population in New York is 15.1%.
What is the Percentage of Black / African American Population in the United States?
Percentage of Black / African American Population in the United States is 12.5%.