Zip Codes with the Highest Percentage of Population Employed in Sales & Related in Sparks, NV
RELATED REPORTS & OPTIONS
Sales & Related
Sparks
Compare Zip Codes
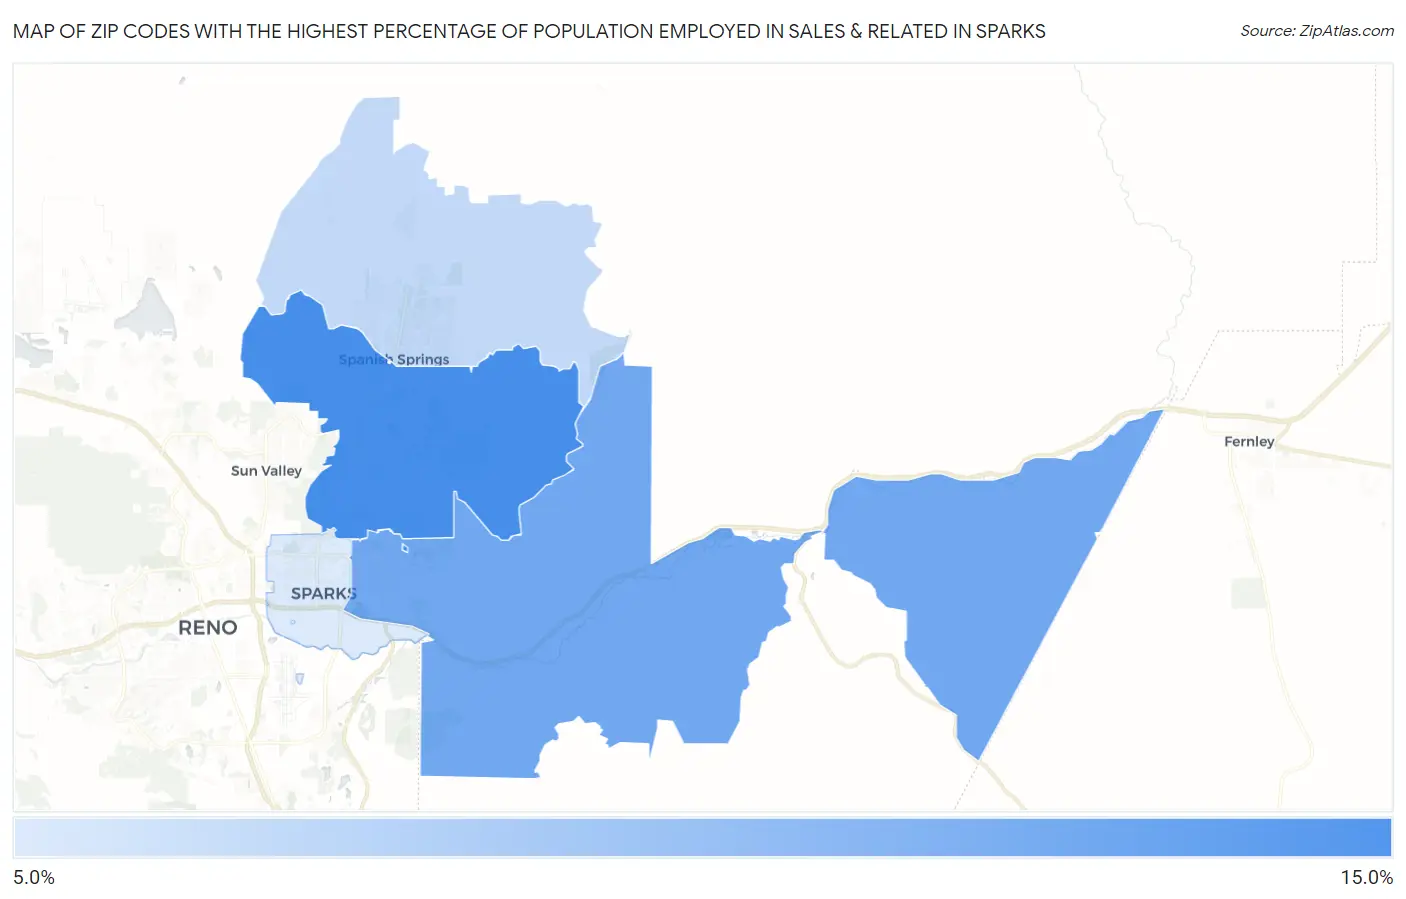
Map of Zip Codes with the Highest Percentage of Population Employed in Sales & Related in Sparks
8.9%
10.4%
Zip Codes with the Highest Percentage of Population Employed in Sales & Related in Sparks, NV
| Zip Code | % Employed | vs State | vs National | |
| 1. | 89436 | 10.4% | 10.4%(-0.050)#74 | 9.6%(+0.776)#9,896 |
| 2. | 89434 | 10.0% | 10.4%(-0.464)#85 | 9.6%(+0.362)#11,149 |
| 3. | 89441 | 9.1% | 10.4%(-1.29)#96 | 9.6%(-0.468)#14,048 |
| 4. | 89431 | 8.9% | 10.4%(-1.56)#103 | 9.6%(-0.738)#15,047 |
1
Common Questions
What are the Top 3 Zip Codes with the Highest Percentage of Population Employed in Sales & Related in Sparks, NV?
Top 3 Zip Codes with the Highest Percentage of Population Employed in Sales & Related in Sparks, NV are:
What zip code has the Highest Percentage of Population Employed in Sales & Related in Sparks, NV?
89436 has the Highest Percentage of Population Employed in Sales & Related in Sparks, NV with 10.4%.
What is the Percentage of Population Employed in Sales & Related in Sparks, NV?
Percentage of Population Employed in Sales & Related in Sparks is 9.8%.
What is the Percentage of Population Employed in Sales & Related in Nevada?
Percentage of Population Employed in Sales & Related in Nevada is 10.4%.
What is the Percentage of Population Employed in Sales & Related in the United States?
Percentage of Population Employed in Sales & Related in the United States is 9.6%.