Zip Codes with the Highest Percentage of Population Employed in Transportation in Sparks, NV
RELATED REPORTS & OPTIONS
Transportation
Sparks
Compare Zip Codes
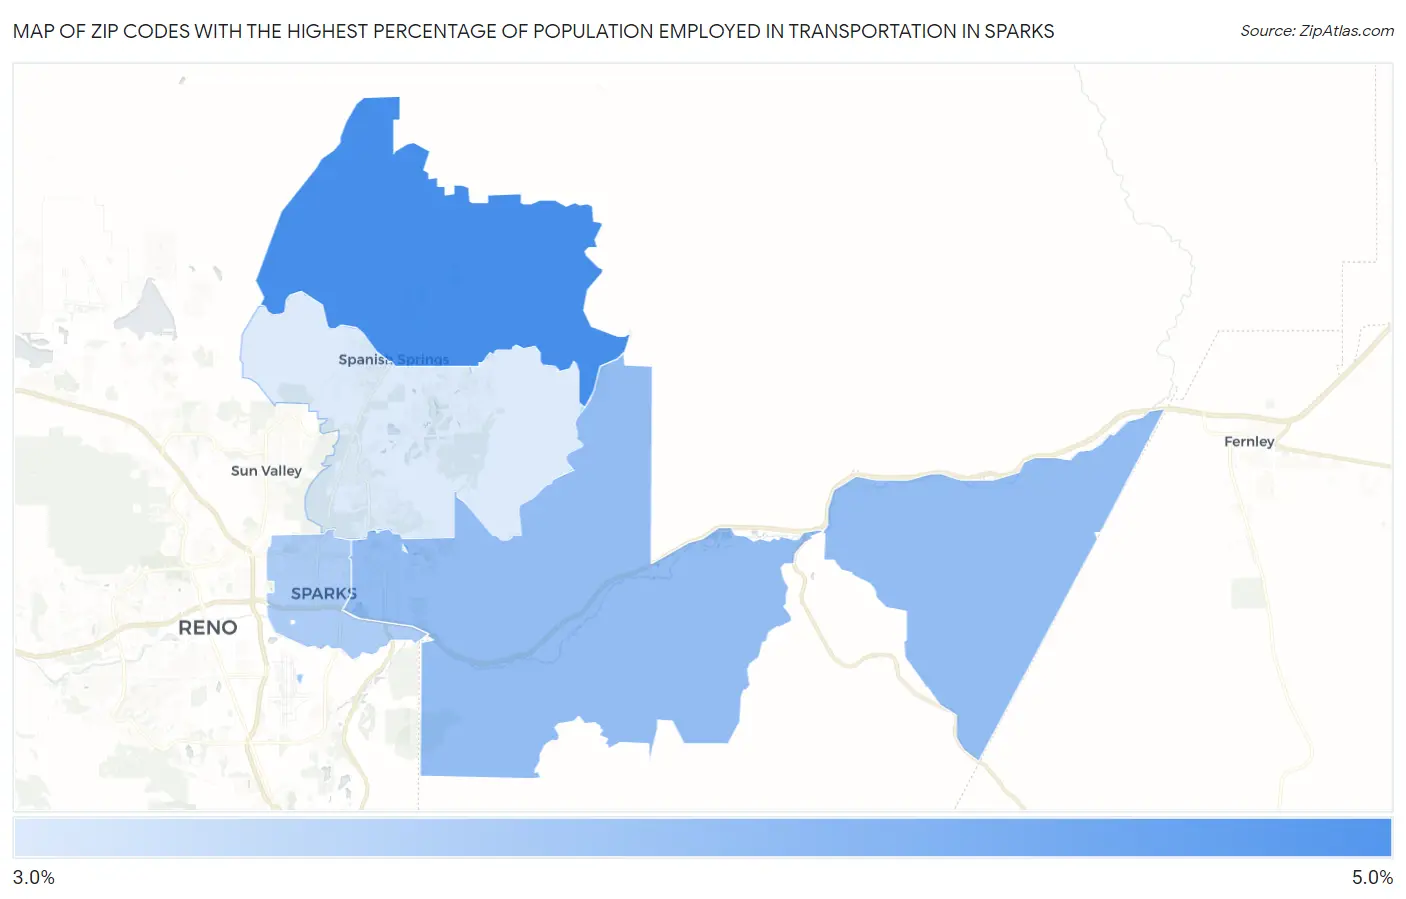
Map of Zip Codes with the Highest Percentage of Population Employed in Transportation in Sparks
0.0%
5.0%
Zip Codes with the Highest Percentage of Population Employed in Transportation in Sparks, NV
| Zip Code | % Employed | vs State | vs National | |
| 1. | 89441 | 4.6% | 4.5%(+0.115)#61 | 3.8%(+0.790)#11,820 |
| 2. | 89434 | 3.8% | 4.5%(-0.665)#82 | 3.8%(+0.011)#15,154 |
| 3. | 89431 | 3.6% | 4.5%(-0.922)#95 | 3.8%(-0.246)#16,485 |
| 4. | 89436 | 3.1% | 4.5%(-1.40)#107 | 3.8%(-0.720)#18,776 |
1
Common Questions
What are the Top 3 Zip Codes with the Highest Percentage of Population Employed in Transportation in Sparks, NV?
Top 3 Zip Codes with the Highest Percentage of Population Employed in Transportation in Sparks, NV are:
What zip code has the Highest Percentage of Population Employed in Transportation in Sparks, NV?
89441 has the Highest Percentage of Population Employed in Transportation in Sparks, NV with 4.6%.
What is the Percentage of Population Employed in Transportation in Sparks, NV?
Percentage of Population Employed in Transportation in Sparks is 3.5%.
What is the Percentage of Population Employed in Transportation in Nevada?
Percentage of Population Employed in Transportation in Nevada is 4.5%.
What is the Percentage of Population Employed in Transportation in the United States?
Percentage of Population Employed in Transportation in the United States is 3.8%.