Zip Codes with the Highest Percentage of Households Heated by Bottled Gas / Liquid Propane in Sparks, NV
RELATED REPORTS & OPTIONS
Bottled Gas / LP Heating
Sparks
Compare Zip Codes
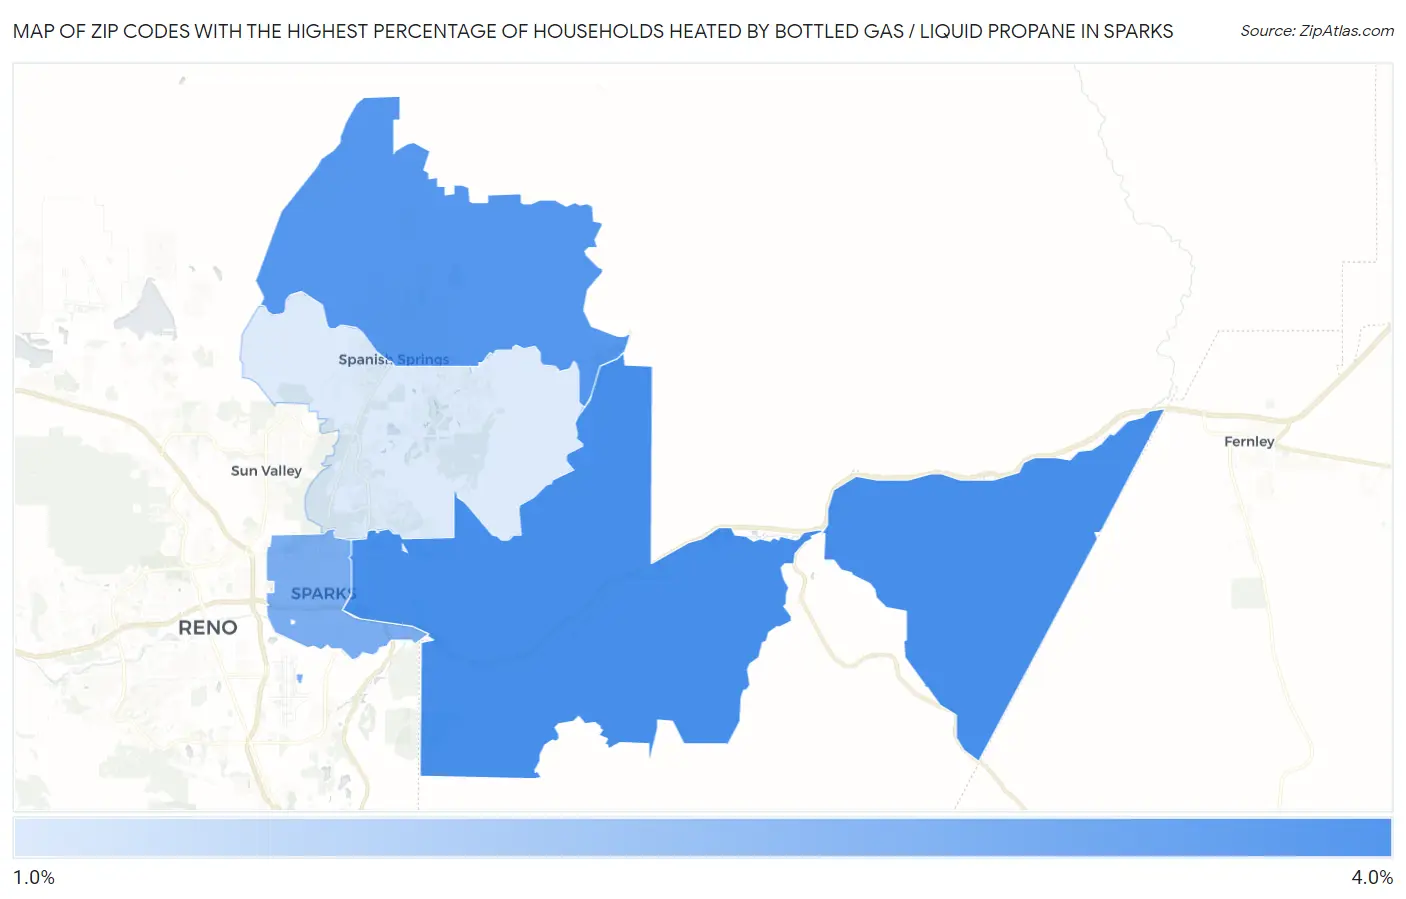
Map of Zip Codes with the Highest Percentage of Households Heated by Bottled Gas / Liquid Propane in Sparks
0.0%
4.0%
Zip Codes with the Highest Percentage of Households Heated by Bottled Gas / Liquid Propane in Sparks, NV
| Zip Code | Bottled Gas / LP Heating | vs State | vs National | |
| 1. | 89434 | 3.6% | 2.8%(+0.800)#72 | 4.9%(-1.30)#20,101 |
| 2. | 89441 | 3.4% | 2.8%(+0.600)#73 | 4.9%(-1.50)#20,406 |
| 3. | 89431 | 2.8% | 2.8%(=0.000)#78 | 4.9%(-2.10)#21,335 |
| 4. | 89436 | 1.3% | 2.8%(-1.50)#116 | 4.9%(-3.60)#25,371 |
1
Common Questions
What are the Top 3 Zip Codes with the Highest Percentage of Households Heated by Bottled Gas / Liquid Propane in Sparks, NV?
Top 3 Zip Codes with the Highest Percentage of Households Heated by Bottled Gas / Liquid Propane in Sparks, NV are:
What zip code has the Highest Percentage of Households Heated by Bottled Gas / Liquid Propane in Sparks, NV?
89434 has the Highest Percentage of Households Heated by Bottled Gas / Liquid Propane in Sparks, NV with 3.6%.
What is the Percentage of Households Heated by Bottled Gas / Liquid Propane in Sparks, NV?
Percentage of Households Heated by Bottled Gas / Liquid Propane in Sparks is 1.7%.
What is the Percentage of Households Heated by Bottled Gas / Liquid Propane in Nevada?
Percentage of Households Heated by Bottled Gas / Liquid Propane in Nevada is 2.8%.
What is the Percentage of Households Heated by Bottled Gas / Liquid Propane in the United States?
Percentage of Households Heated by Bottled Gas / Liquid Propane in the United States is 4.9%.