Zip Codes with the Highest Percentage of Households Heated by Utility Gas in Reno, NV
RELATED REPORTS & OPTIONS
Utility Gas Heating
Reno
Compare Zip Codes
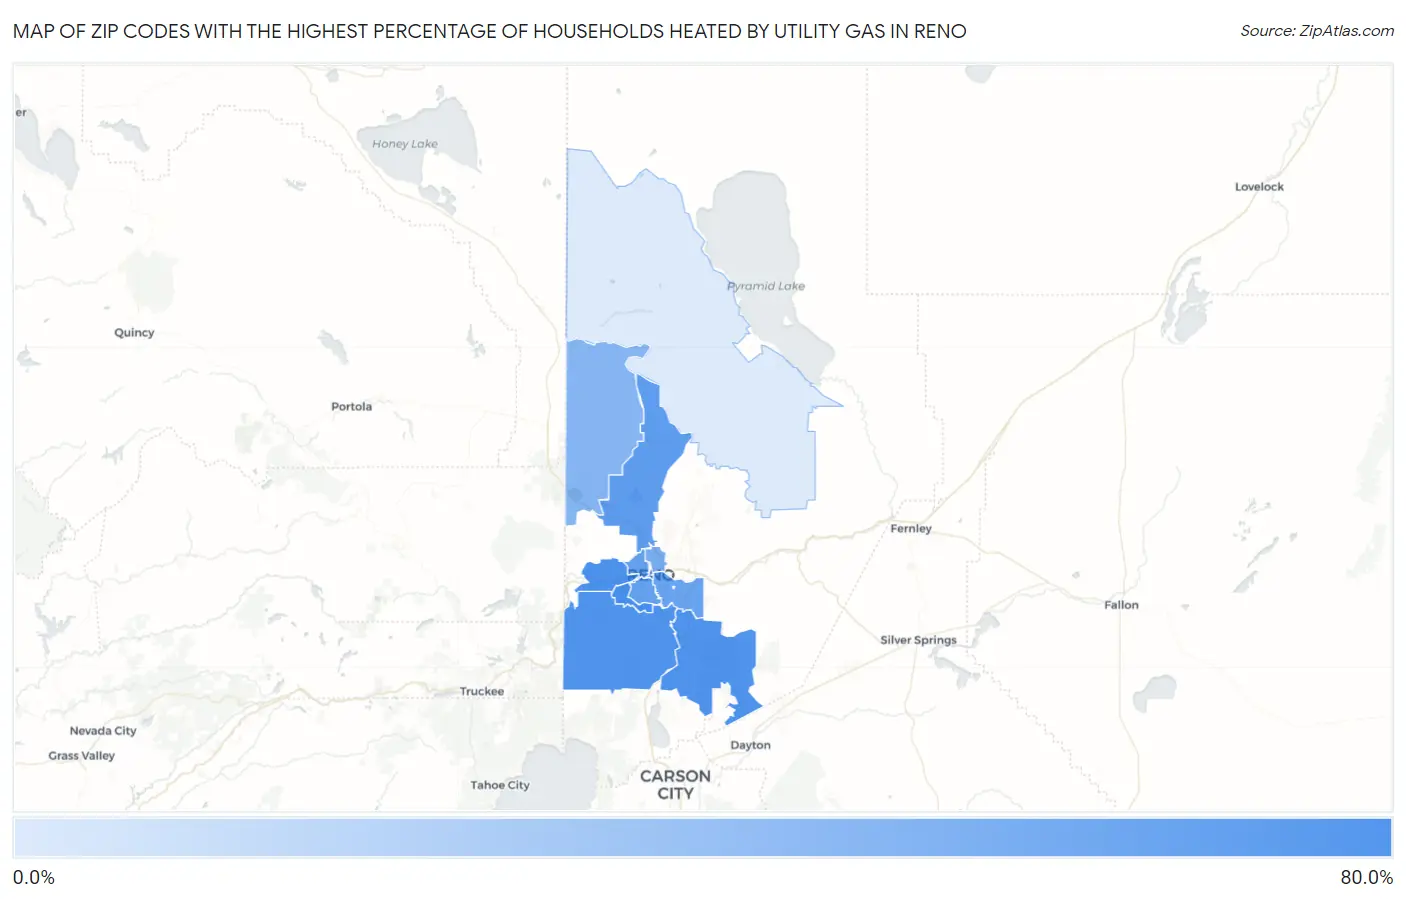
Map of Zip Codes with the Highest Percentage of Households Heated by Utility Gas in Reno
0.0%
80.0%
Zip Codes with the Highest Percentage of Households Heated by Utility Gas in Reno, NV
| Zip Code | Utility Gas Heating | vs State | vs National | |
| 1. | 89519 | 69.7% | 58.0%(+11.7)#40 | 47.1%(+22.6)#4,698 |
| 2. | 89523 | 67.2% | 58.0%(+9.20)#51 | 47.1%(+20.1)#5,389 |
| 3. | 89521 | 66.0% | 58.0%(+8.00)#54 | 47.1%(+18.9)#5,698 |
| 4. | 89511 | 64.2% | 58.0%(+6.20)#59 | 47.1%(+17.1)#6,216 |
| 5. | 89506 | 57.1% | 58.0%(-0.900)#70 | 47.1%(+10.0)#8,211 |
| 6. | 89509 | 55.5% | 58.0%(-2.50)#74 | 47.1%(+8.40)#8,688 |
| 7. | 89503 | 53.8% | 58.0%(-4.20)#76 | 47.1%(+6.70)#9,157 |
| 8. | 89502 | 52.4% | 58.0%(-5.60)#79 | 47.1%(+5.30)#9,530 |
| 9. | 89557 | 47.8% | 58.0%(-10.2)#88 | 47.1%(+0.700)#10,895 |
| 10. | 89512 | 44.2% | 58.0%(-13.8)#90 | 47.1%(-2.90)#11,912 |
| 11. | 89508 | 39.3% | 58.0%(-18.7)#96 | 47.1%(-7.80)#13,314 |
| 12. | 89501 | 27.0% | 58.0%(-31.0)#105 | 47.1%(-20.1)#16,581 |
| 13. | 89510 | 4.9% | 58.0%(-53.1)#124 | 47.1%(-42.2)#23,032 |
1
Common Questions
What are the Top 10 Zip Codes with the Highest Percentage of Households Heated by Utility Gas in Reno, NV?
Top 10 Zip Codes with the Highest Percentage of Households Heated by Utility Gas in Reno, NV are:
What zip code has the Highest Percentage of Households Heated by Utility Gas in Reno, NV?
89519 has the Highest Percentage of Households Heated by Utility Gas in Reno, NV with 69.7%.
What is the Percentage of Households Heated by Utility Gas in Reno, NV?
Percentage of Households Heated by Utility Gas in Reno is 58.0%.
What is the Percentage of Households Heated by Utility Gas in Nevada?
Percentage of Households Heated by Utility Gas in Nevada is 58.0%.
What is the Percentage of Households Heated by Utility Gas in the United States?
Percentage of Households Heated by Utility Gas in the United States is 47.1%.