Zip Codes with the Highest Percentage of Population Employed in Farming, Fishing & Forestry in Reno, NV
RELATED REPORTS & OPTIONS
Farming, Fishing & Forestry
Reno
Compare Zip Codes
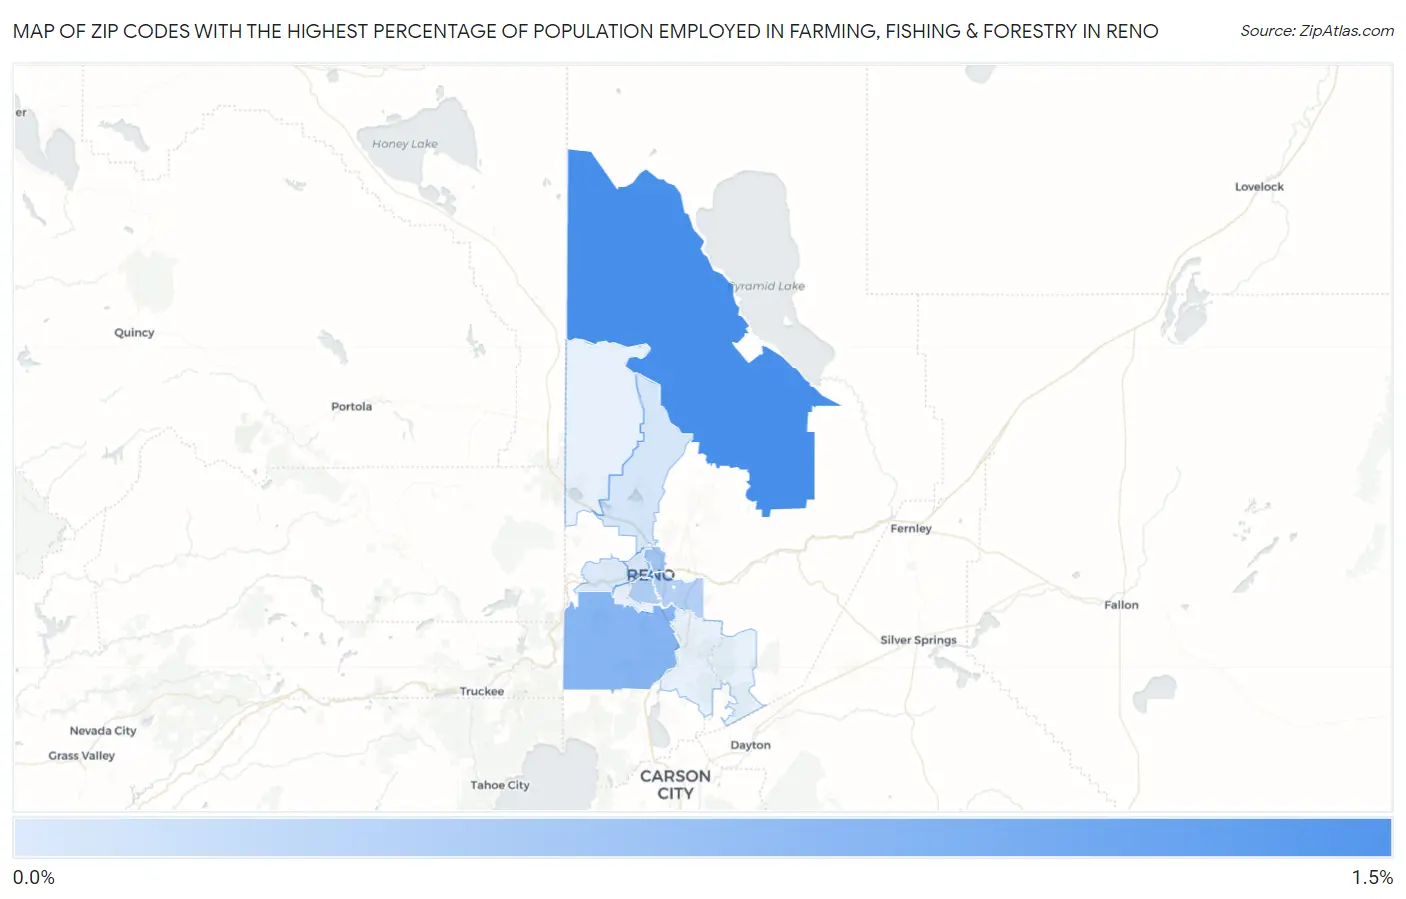
Map of Zip Codes with the Highest Percentage of Population Employed in Farming, Fishing & Forestry in Reno
0.0%
1.5%
Zip Codes with the Highest Percentage of Population Employed in Farming, Fishing & Forestry in Reno, NV
| Zip Code | % Employed | vs State | vs National | |
| 1. | 89510 | 1.0% | 0.19%(+0.850)#22 | 0.61%(+0.431)#9,578 |
| 2. | 89501 | 0.95% | 0.19%(+0.760)#23 | 0.61%(+0.341)#10,007 |
| 3. | 89511 | 0.62% | 0.19%(+0.435)#26 | 0.61%(+0.016)#11,875 |
| 4. | 89512 | 0.45% | 0.19%(+0.266)#31 | 0.61%(-0.153)#13,258 |
| 5. | 89509 | 0.35% | 0.19%(+0.159)#38 | 0.61%(-0.260)#14,310 |
| 6. | 89502 | 0.32% | 0.19%(+0.132)#43 | 0.61%(-0.287)#14,614 |
| 7. | 89506 | 0.098% | 0.19%(-0.089)#65 | 0.61%(-0.508)#17,805 |
| 8. | 89523 | 0.058% | 0.19%(-0.129)#78 | 0.61%(-0.547)#18,514 |
| 9. | 89503 | 0.054% | 0.19%(-0.132)#79 | 0.61%(-0.551)#18,587 |
1
Common Questions
What are the Top 10 Zip Codes with the Highest Percentage of Population Employed in Farming, Fishing & Forestry in Reno, NV?
Top 10 Zip Codes with the Highest Percentage of Population Employed in Farming, Fishing & Forestry in Reno, NV are:
What zip code has the Highest Percentage of Population Employed in Farming, Fishing & Forestry in Reno, NV?
89510 has the Highest Percentage of Population Employed in Farming, Fishing & Forestry in Reno, NV with 1.0%.
What is the Percentage of Population Employed in Farming, Fishing & Forestry in Reno, NV?
Percentage of Population Employed in Farming, Fishing & Forestry in Reno is 0.25%.
What is the Percentage of Population Employed in Farming, Fishing & Forestry in Nevada?
Percentage of Population Employed in Farming, Fishing & Forestry in Nevada is 0.19%.
What is the Percentage of Population Employed in Farming, Fishing & Forestry in the United States?
Percentage of Population Employed in Farming, Fishing & Forestry in the United States is 0.61%.