Zip Codes with the Highest Percentage of Population Employed in Transportation & Warehousing in North Las Vegas, NV
RELATED REPORTS & OPTIONS
Transportation & Warehousing
North Las Vegas
Compare Zip Codes
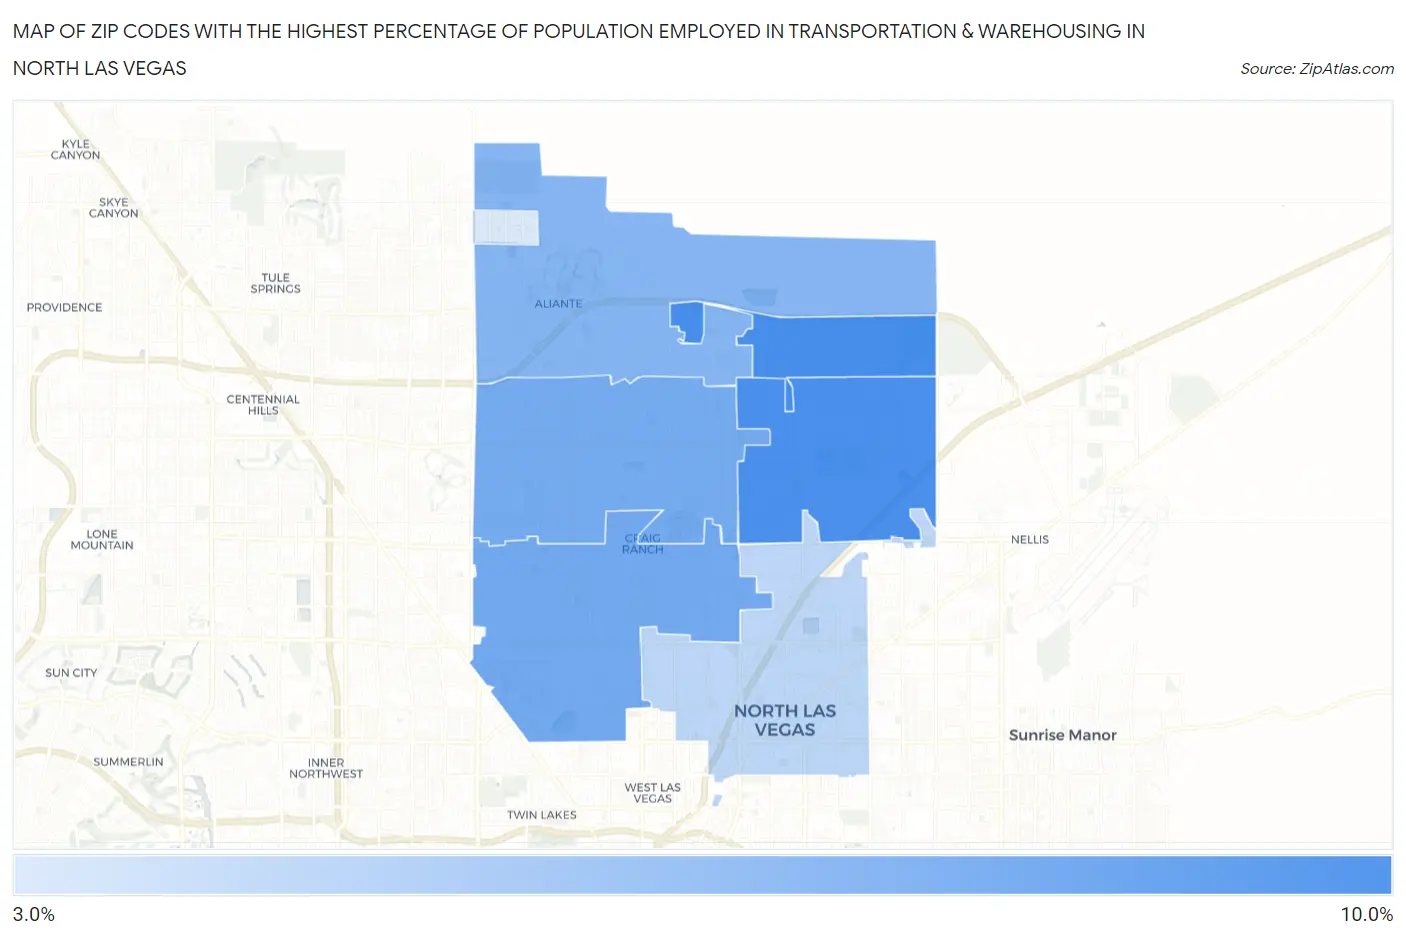
Map of Zip Codes with the Highest Percentage of Population Employed in Transportation & Warehousing in North Las Vegas
0.0%
10.0%
Zip Codes with the Highest Percentage of Population Employed in Transportation & Warehousing in North Las Vegas, NV
| Zip Code | % Employed | vs State | vs National | |
| 1. | 89086 | 9.0% | 6.1%(+2.88)#21 | 4.9%(+4.07)#3,678 |
| 2. | 89081 | 8.9% | 6.1%(+2.81)#22 | 4.9%(+4.00)#3,757 |
| 3. | 89032 | 7.5% | 6.1%(+1.32)#35 | 4.9%(+2.51)#5,727 |
| 4. | 89031 | 7.3% | 6.1%(+1.21)#38 | 4.9%(+2.40)#5,911 |
| 5. | 89084 | 6.8% | 6.1%(+0.631)#48 | 4.9%(+1.82)#7,035 |
| 6. | 89030 | 4.9% | 6.1%(-1.28)#86 | 4.9%(-0.094)#12,437 |
| 7. | 89085 | 3.7% | 6.1%(-2.42)#102 | 4.9%(-1.23)#17,171 |
1
Common Questions
What are the Top 5 Zip Codes with the Highest Percentage of Population Employed in Transportation & Warehousing in North Las Vegas, NV?
Top 5 Zip Codes with the Highest Percentage of Population Employed in Transportation & Warehousing in North Las Vegas, NV are:
What zip code has the Highest Percentage of Population Employed in Transportation & Warehousing in North Las Vegas, NV?
89086 has the Highest Percentage of Population Employed in Transportation & Warehousing in North Las Vegas, NV with 9.0%.
What is the Percentage of Population Employed in Transportation & Warehousing in North Las Vegas, NV?
Percentage of Population Employed in Transportation & Warehousing in North Las Vegas is 7.1%.
What is the Percentage of Population Employed in Transportation & Warehousing in Nevada?
Percentage of Population Employed in Transportation & Warehousing in Nevada is 6.1%.
What is the Percentage of Population Employed in Transportation & Warehousing in the United States?
Percentage of Population Employed in Transportation & Warehousing in the United States is 4.9%.