Zip Codes with the Highest Percentage of Population Employed in Farming, Fishing & Forestry in Henderson, NV
RELATED REPORTS & OPTIONS
Farming, Fishing & Forestry
Henderson
Compare Zip Codes
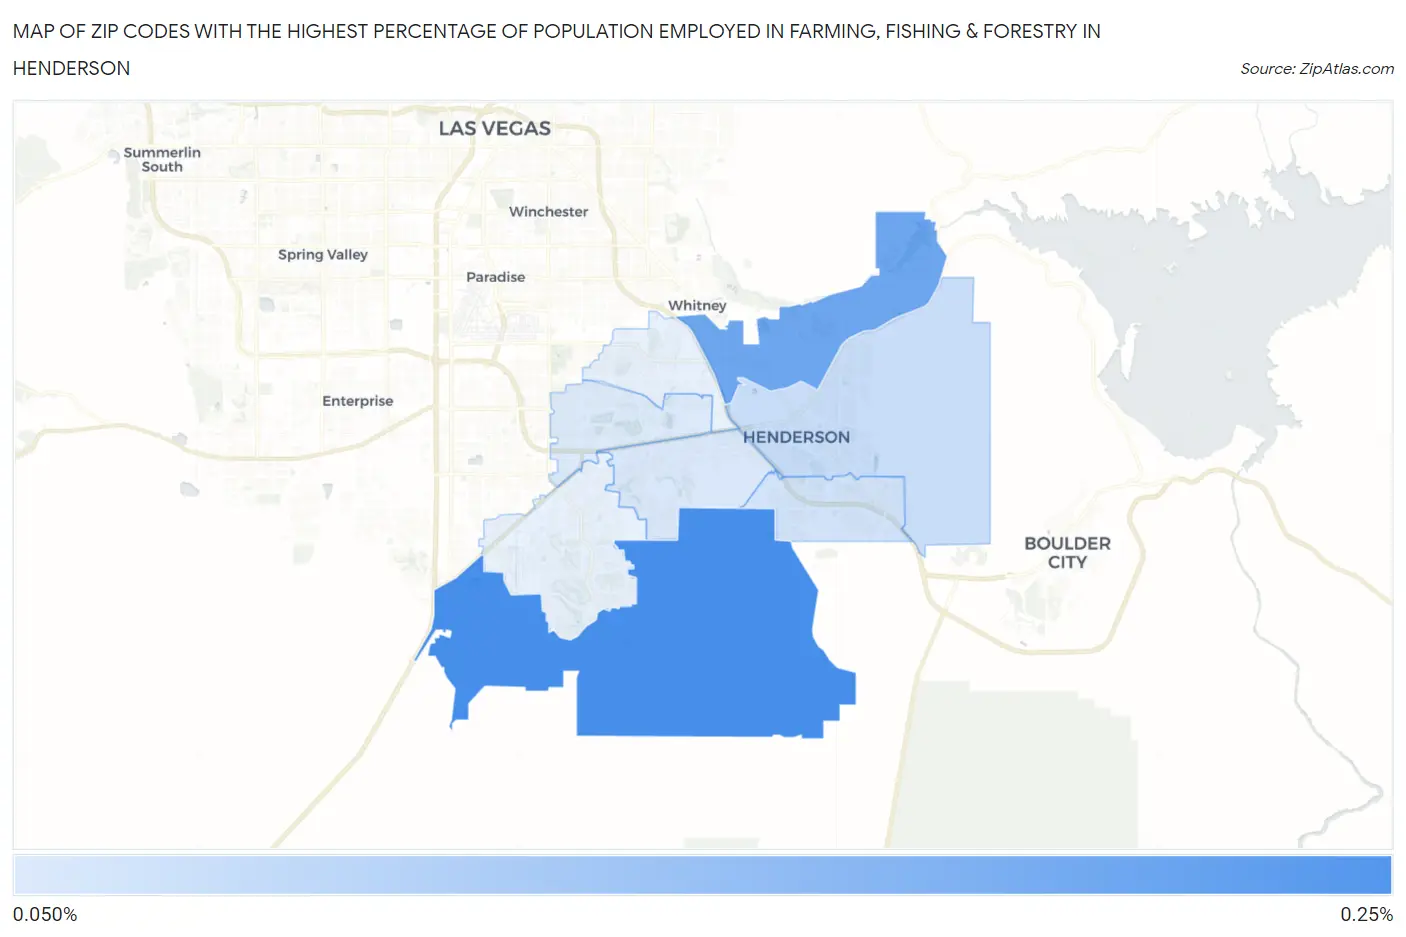
Map of Zip Codes with the Highest Percentage of Population Employed in Farming, Fishing & Forestry in Henderson
0.0%
0.25%
Zip Codes with the Highest Percentage of Population Employed in Farming, Fishing & Forestry in Henderson, NV
| Zip Code | % Employed | vs State | vs National | |
| 1. | 89044 | 0.21% | 0.19%(+0.025)#46 | 0.61%(-0.394)#15,973 |
| 2. | 89011 | 0.18% | 0.19%(-0.011)#51 | 0.61%(-0.430)#16,491 |
| 3. | 89015 | 0.091% | 0.19%(-0.095)#68 | 0.61%(-0.514)#17,905 |
| 4. | 89002 | 0.083% | 0.19%(-0.103)#71 | 0.61%(-0.522)#18,049 |
| 5. | 89012 | 0.074% | 0.19%(-0.113)#75 | 0.61%(-0.532)#18,236 |
| 6. | 89074 | 0.072% | 0.19%(-0.115)#77 | 0.61%(-0.534)#18,268 |
1
Common Questions
What are the Top 5 Zip Codes with the Highest Percentage of Population Employed in Farming, Fishing & Forestry in Henderson, NV?
Top 5 Zip Codes with the Highest Percentage of Population Employed in Farming, Fishing & Forestry in Henderson, NV are:
What zip code has the Highest Percentage of Population Employed in Farming, Fishing & Forestry in Henderson, NV?
89044 has the Highest Percentage of Population Employed in Farming, Fishing & Forestry in Henderson, NV with 0.21%.
What is the Percentage of Population Employed in Farming, Fishing & Forestry in Henderson, NV?
Percentage of Population Employed in Farming, Fishing & Forestry in Henderson is 0.079%.
What is the Percentage of Population Employed in Farming, Fishing & Forestry in Nevada?
Percentage of Population Employed in Farming, Fishing & Forestry in Nevada is 0.19%.
What is the Percentage of Population Employed in Farming, Fishing & Forestry in the United States?
Percentage of Population Employed in Farming, Fishing & Forestry in the United States is 0.61%.