Zip Codes with the Highest Percentage of Population Employed in Sales & Related in Gallup, NM
RELATED REPORTS & OPTIONS
Sales & Related
Gallup
Compare Zip Codes
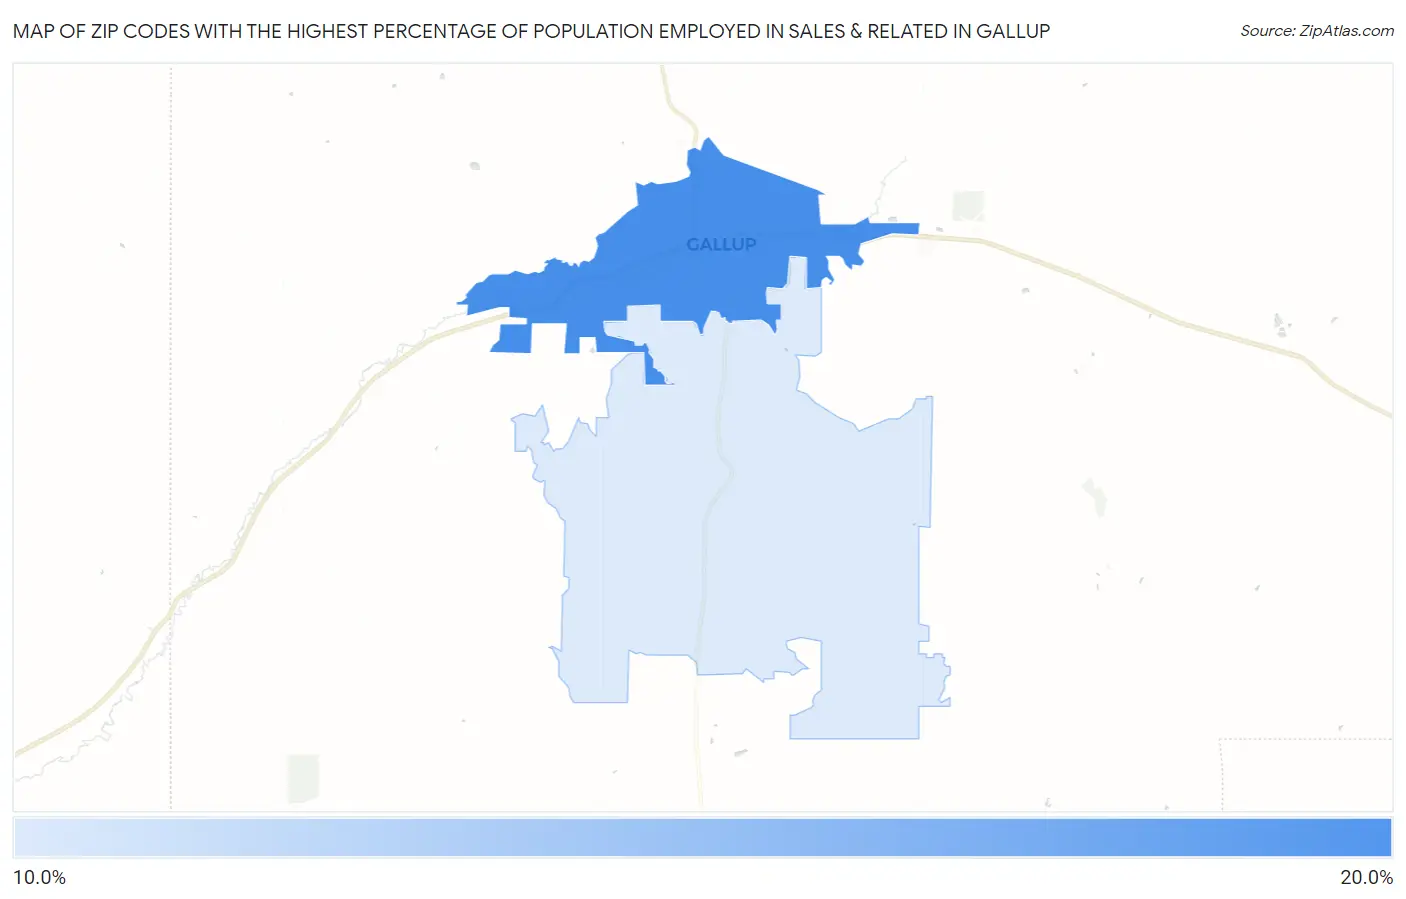
Map of Zip Codes with the Highest Percentage of Population Employed in Sales & Related in Gallup
0.0%
20.0%
Zip Codes with the Highest Percentage of Population Employed in Sales & Related in Gallup, NM
| Zip Code | % Employed | vs State | vs National | |
| 1. | 87301 | 16.8% | 9.3%(+7.56)#35 | 9.6%(+7.23)#1,890 |
| 2. | 87305 | 10.7% | 9.3%(+1.42)#80 | 9.6%(+1.09)#9,045 |
1
Common Questions
What are the Top Zip Codes with the Highest Percentage of Population Employed in Sales & Related in Gallup, NM?
Top Zip Codes with the Highest Percentage of Population Employed in Sales & Related in Gallup, NM are:
What zip code has the Highest Percentage of Population Employed in Sales & Related in Gallup, NM?
87301 has the Highest Percentage of Population Employed in Sales & Related in Gallup, NM with 16.8%.
What is the Percentage of Population Employed in Sales & Related in Gallup, NM?
Percentage of Population Employed in Sales & Related in Gallup is 17.3%.
What is the Percentage of Population Employed in Sales & Related in New Mexico?
Percentage of Population Employed in Sales & Related in New Mexico is 9.3%.
What is the Percentage of Population Employed in Sales & Related in the United States?
Percentage of Population Employed in Sales & Related in the United States is 9.6%.