Zip Codes with the Highest Percentage of Households Heated by Utility Gas in Gallup, NM
RELATED REPORTS & OPTIONS
Utility Gas Heating
Gallup
Compare Zip Codes
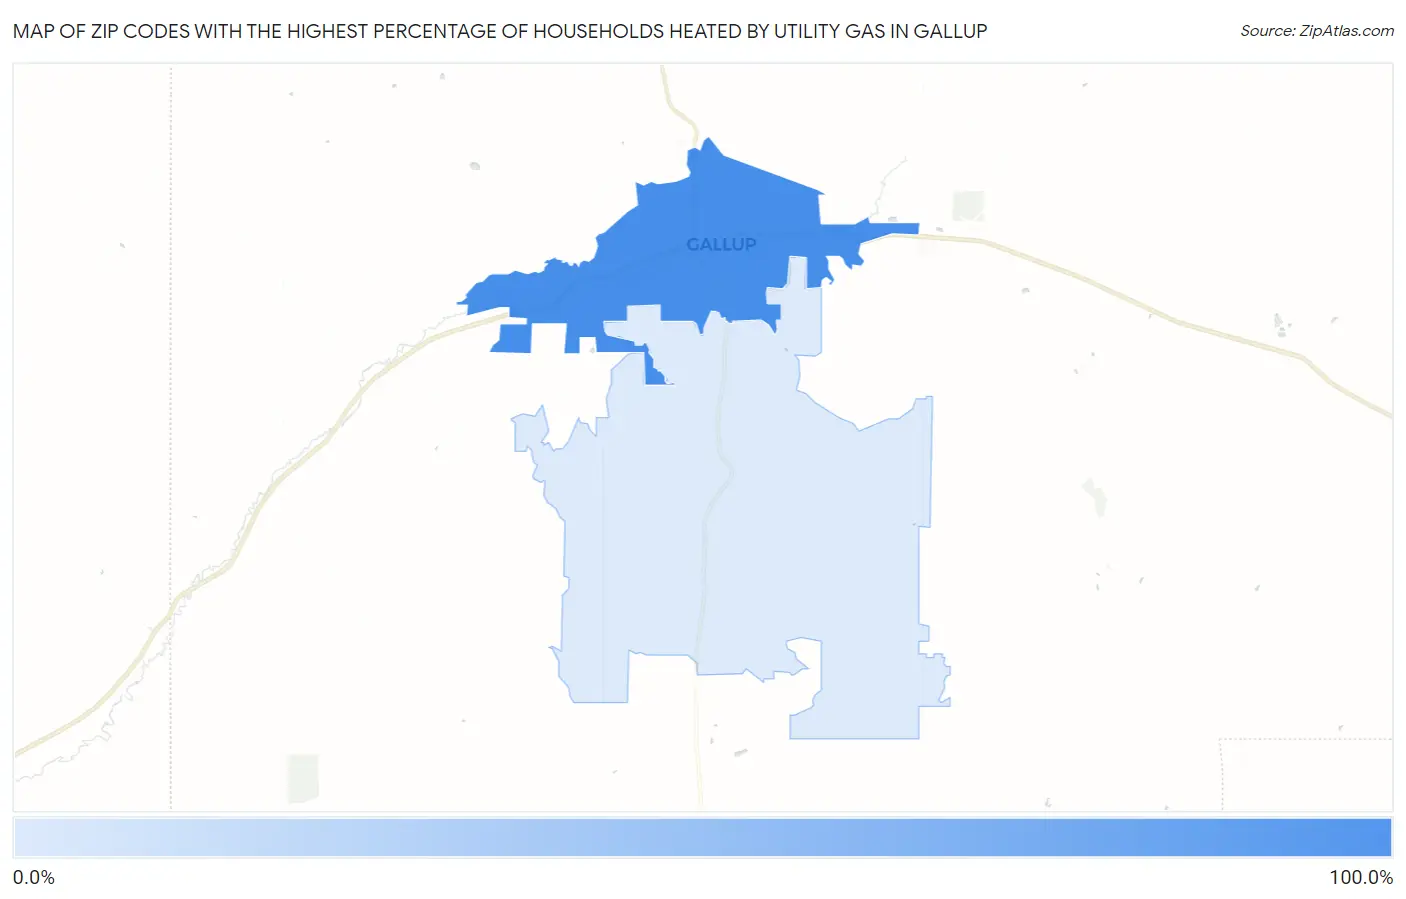
Map of Zip Codes with the Highest Percentage of Households Heated by Utility Gas in Gallup
11.5%
82.1%
Zip Codes with the Highest Percentage of Households Heated by Utility Gas in Gallup, NM
| Zip Code | Utility Gas Heating | vs State | vs National | |
| 1. | 87301 | 82.1% | 62.0%(+20.1)#12 | 47.1%(+35.0)#1,856 |
| 2. | 87305 | 11.5% | 62.0%(-50.5)#200 | 47.1%(-35.6)#20,387 |
1
Common Questions
What are the Top Zip Codes with the Highest Percentage of Households Heated by Utility Gas in Gallup, NM?
Top Zip Codes with the Highest Percentage of Households Heated by Utility Gas in Gallup, NM are:
What zip code has the Highest Percentage of Households Heated by Utility Gas in Gallup, NM?
87301 has the Highest Percentage of Households Heated by Utility Gas in Gallup, NM with 82.1%.
What is the Percentage of Households Heated by Utility Gas in Gallup, NM?
Percentage of Households Heated by Utility Gas in Gallup is 83.1%.
What is the Percentage of Households Heated by Utility Gas in New Mexico?
Percentage of Households Heated by Utility Gas in New Mexico is 62.0%.
What is the Percentage of Households Heated by Utility Gas in the United States?
Percentage of Households Heated by Utility Gas in the United States is 47.1%.