Zip Codes with the Highest Percentage of Population Employed in Farming, Fishing & Forestry in Clifton, NJ
RELATED REPORTS & OPTIONS
Farming, Fishing & Forestry
Clifton
Compare Zip Codes
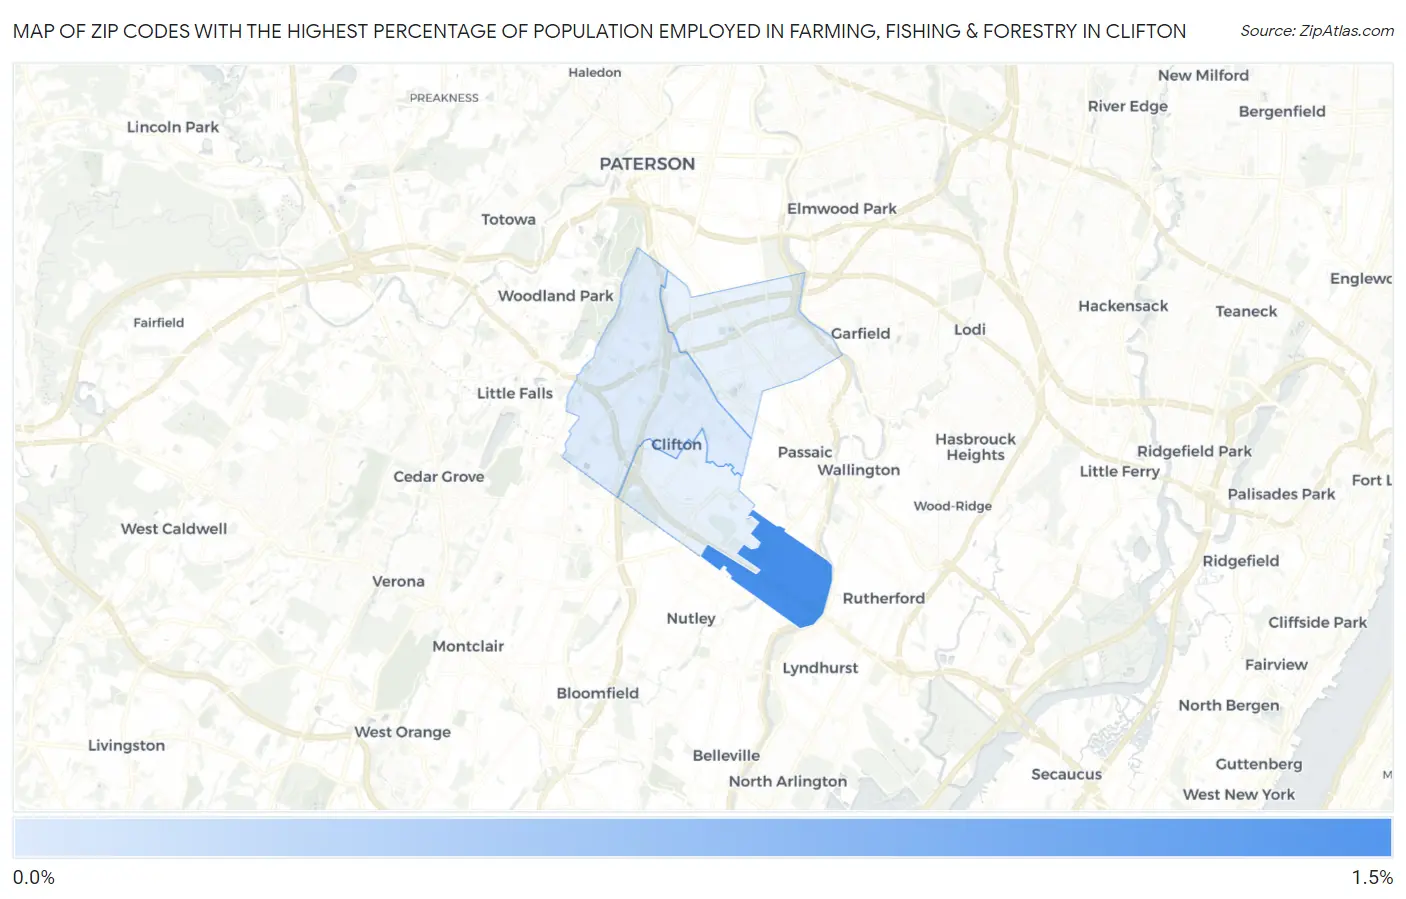
Map of Zip Codes with the Highest Percentage of Population Employed in Farming, Fishing & Forestry in Clifton
0.0%
1.5%
Zip Codes with the Highest Percentage of Population Employed in Farming, Fishing & Forestry in Clifton, NJ
| Zip Code | % Employed | vs State | vs National | |
| 1. | 07014 | 1.0% | 0.14%(+0.900)#25 | 0.61%(+0.438)#9,543 |
| 2. | 07013 | 0.12% | 0.14%(-0.024)#156 | 0.61%(-0.486)#17,431 |
1
Common Questions
What are the Top 3 Zip Codes with the Highest Percentage of Population Employed in Farming, Fishing & Forestry in Clifton, NJ?
Top 3 Zip Codes with the Highest Percentage of Population Employed in Farming, Fishing & Forestry in Clifton, NJ are:
What zip code has the Highest Percentage of Population Employed in Farming, Fishing & Forestry in Clifton, NJ?
07014 has the Highest Percentage of Population Employed in Farming, Fishing & Forestry in Clifton, NJ with 1.0%.
What is the Percentage of Population Employed in Farming, Fishing & Forestry in Clifton, NJ?
Percentage of Population Employed in Farming, Fishing & Forestry in Clifton is 0.089%.
What is the Percentage of Population Employed in Farming, Fishing & Forestry in New Jersey?
Percentage of Population Employed in Farming, Fishing & Forestry in New Jersey is 0.14%.
What is the Percentage of Population Employed in Farming, Fishing & Forestry in the United States?
Percentage of Population Employed in Farming, Fishing & Forestry in the United States is 0.61%.