Zip Codes with the Highest Percentage of Population Employed in Farming, Fishing & Forestry in Camden, NJ
RELATED REPORTS & OPTIONS
Farming, Fishing & Forestry
Camden
Compare Zip Codes
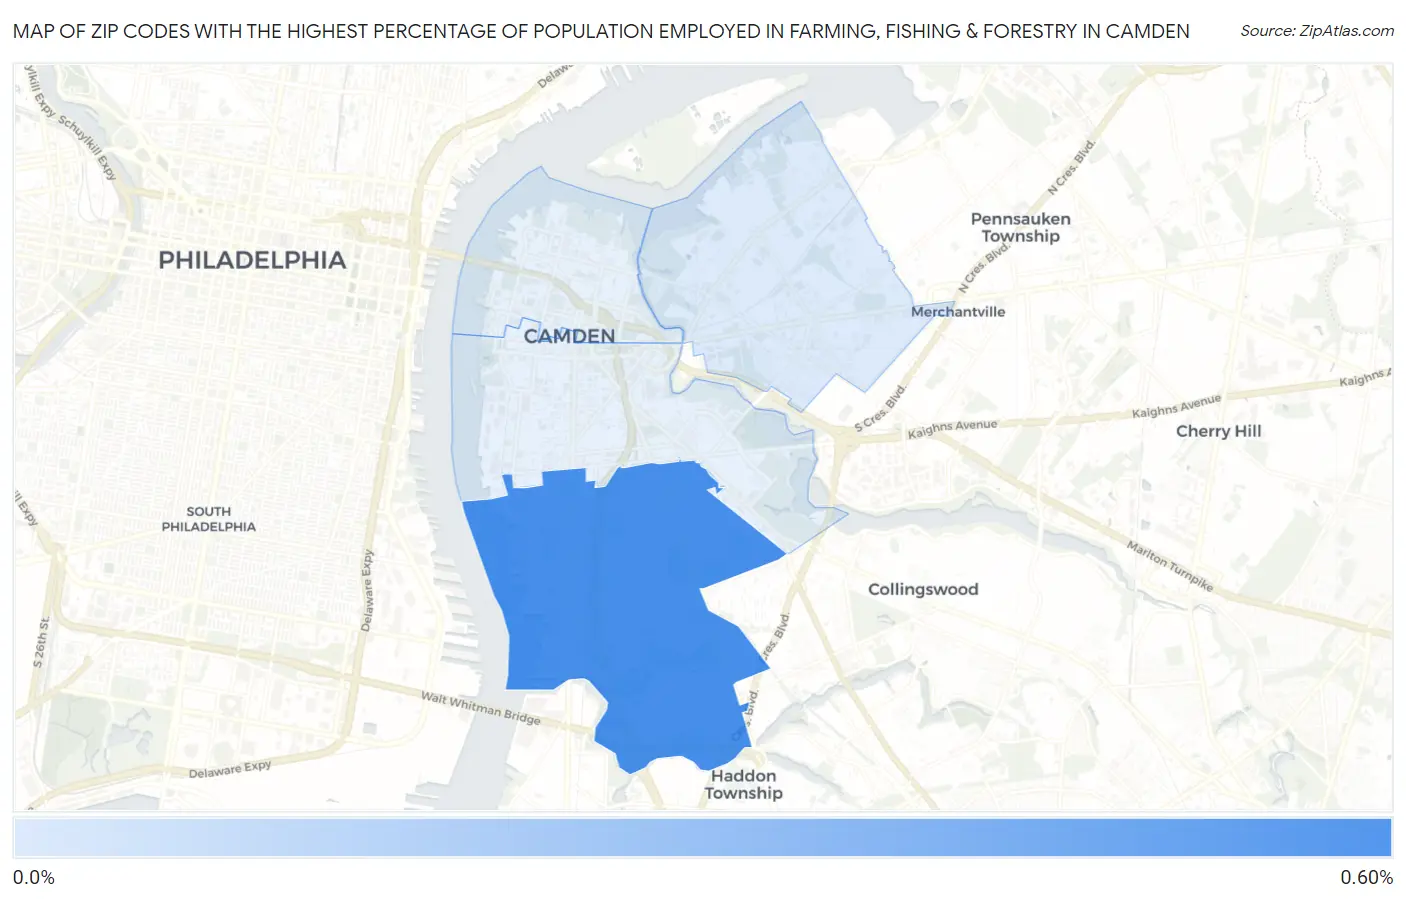
Map of Zip Codes with the Highest Percentage of Population Employed in Farming, Fishing & Forestry in Camden
0.0%
0.60%
Zip Codes with the Highest Percentage of Population Employed in Farming, Fishing & Forestry in Camden, NJ
| Zip Code | % Employed | vs State | vs National | |
| 1. | 08104 | 0.53% | 0.14%(+0.385)#55 | 0.61%(-0.077)#12,612 |
| 2. | 08105 | 0.100% | 0.14%(-0.044)#167 | 0.61%(-0.506)#17,764 |
1
Common Questions
What are the Top 3 Zip Codes with the Highest Percentage of Population Employed in Farming, Fishing & Forestry in Camden, NJ?
Top 3 Zip Codes with the Highest Percentage of Population Employed in Farming, Fishing & Forestry in Camden, NJ are:
What zip code has the Highest Percentage of Population Employed in Farming, Fishing & Forestry in Camden, NJ?
08104 has the Highest Percentage of Population Employed in Farming, Fishing & Forestry in Camden, NJ with 0.53%.
What is the Percentage of Population Employed in Farming, Fishing & Forestry in Camden, NJ?
Percentage of Population Employed in Farming, Fishing & Forestry in Camden is 0.19%.
What is the Percentage of Population Employed in Farming, Fishing & Forestry in New Jersey?
Percentage of Population Employed in Farming, Fishing & Forestry in New Jersey is 0.14%.
What is the Percentage of Population Employed in Farming, Fishing & Forestry in the United States?
Percentage of Population Employed in Farming, Fishing & Forestry in the United States is 0.61%.