Zip Codes with the Highest Percentage of Self-Employed / Incorporated in New Hampshire
RELATED REPORTS & OPTIONS
Self-Employed / Incorporated
New Hampshire
Compare Zip Codes
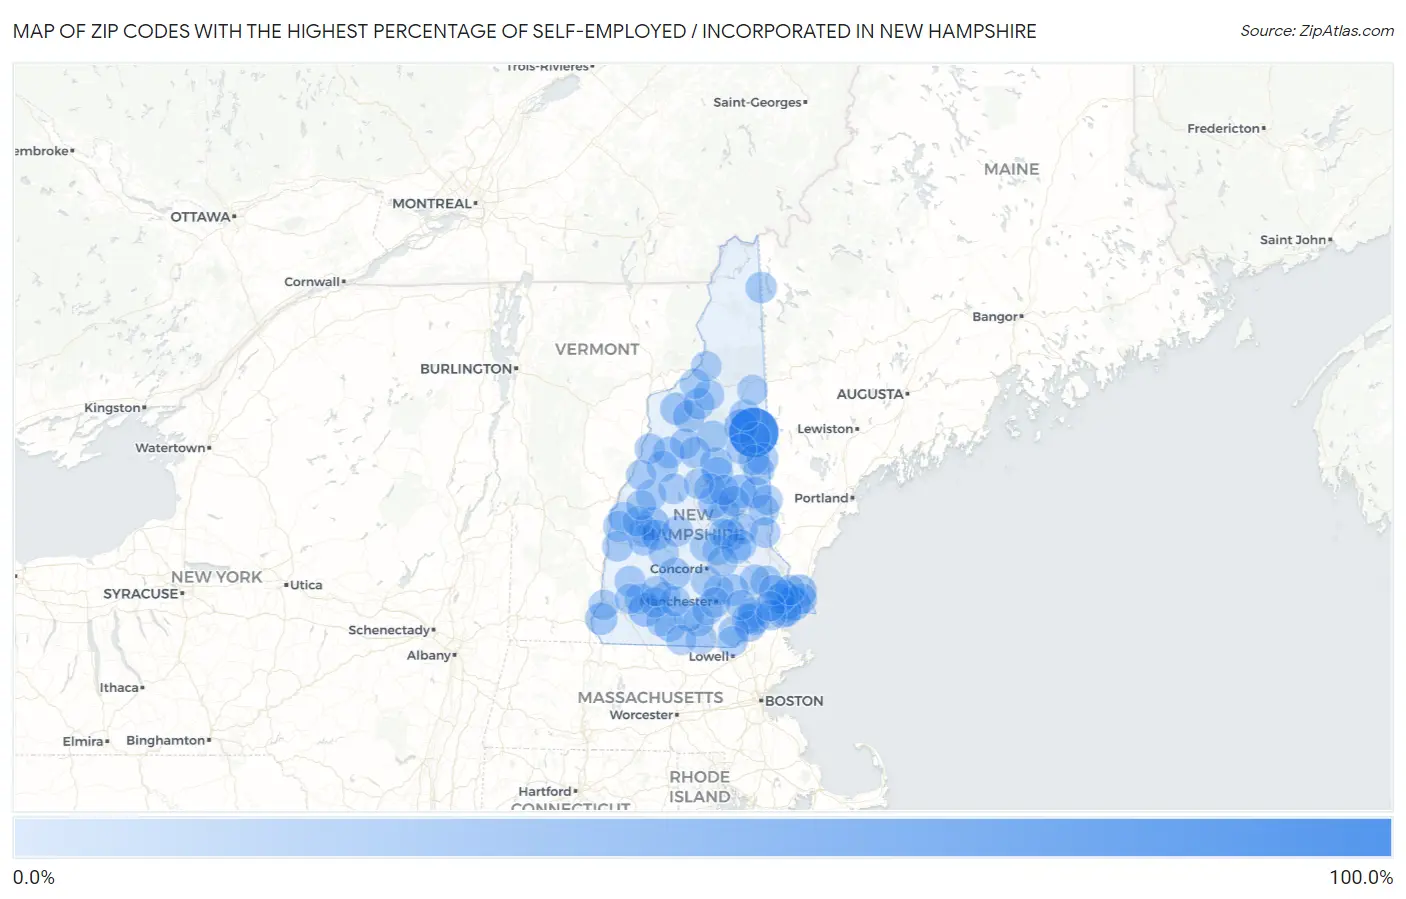
Map of Zip Codes with the Highest Percentage of Self-Employed / Incorporated in New Hampshire
0.0%
100.0%
Zip Codes with the Highest Percentage of Self-Employed / Incorporated in New Hampshire
| Zip Code | % Self-Employed / Incorporated | vs State | vs National | |
| 1. | 03847 | 80.8% | 3.0%(+77.9)#1 | 3.8%(+77.0)#29 |
| 2. | 03871 | 17.7% | 3.0%(+14.8)#2 | 3.8%(+13.9)#646 |
| 3. | 03838 | 16.6% | 3.0%(+13.6)#3 | 3.8%(+12.7)#755 |
| 4. | 03450 | 15.5% | 3.0%(+12.6)#4 | 3.8%(+11.7)#877 |
| 5. | 03854 | 15.2% | 3.0%(+12.3)#5 | 3.8%(+11.4)#915 |
| 6. | 03284 | 15.2% | 3.0%(+12.3)#6 | 3.8%(+11.4)#917 |
| 7. | 03816 | 14.0% | 3.0%(+11.0)#7 | 3.8%(+10.2)#1,131 |
| 8. | 03826 | 12.2% | 3.0%(+9.25)#8 | 3.8%(+8.39)#1,516 |
| 9. | 03259 | 11.6% | 3.0%(+8.67)#9 | 3.8%(+7.81)#1,683 |
| 10. | 03586 | 11.0% | 3.0%(+8.09)#10 | 3.8%(+7.22)#1,879 |
| 11. | 03443 | 10.4% | 3.0%(+7.48)#11 | 3.8%(+6.62)#2,114 |
| 12. | 03580 | 9.8% | 3.0%(+6.86)#12 | 3.8%(+6.00)#2,407 |
| 13. | 03751 | 9.6% | 3.0%(+6.68)#13 | 3.8%(+5.82)#2,500 |
| 14. | 03034 | 9.2% | 3.0%(+6.29)#14 | 3.8%(+5.43)#2,729 |
| 15. | 03249 | 8.7% | 3.0%(+5.74)#15 | 3.8%(+4.87)#3,088 |
| 16. | 03242 | 8.6% | 3.0%(+5.67)#16 | 3.8%(+4.81)#3,125 |
| 17. | 03832 | 8.6% | 3.0%(+5.62)#17 | 3.8%(+4.75)#3,176 |
| 18. | 03279 | 8.0% | 3.0%(+5.02)#18 | 3.8%(+4.16)#3,686 |
| 19. | 03215 | 7.7% | 3.0%(+4.74)#19 | 3.8%(+3.88)#3,979 |
| 20. | 03862 | 7.7% | 3.0%(+4.70)#20 | 3.8%(+3.83)#4,019 |
| 21. | 03837 | 7.2% | 3.0%(+4.24)#21 | 3.8%(+3.38)#4,520 |
| 22. | 03574 | 6.9% | 3.0%(+3.99)#22 | 3.8%(+3.13)#4,829 |
| 23. | 03579 | 6.9% | 3.0%(+3.94)#23 | 3.8%(+3.08)#4,901 |
| 24. | 03860 | 6.8% | 3.0%(+3.81)#24 | 3.8%(+2.95)#5,078 |
| 25. | 03861 | 6.7% | 3.0%(+3.78)#25 | 3.8%(+2.92)#5,134 |
| 26. | 03253 | 6.7% | 3.0%(+3.75)#26 | 3.8%(+2.89)#5,170 |
| 27. | 03870 | 6.5% | 3.0%(+3.58)#27 | 3.8%(+2.72)#5,432 |
| 28. | 03844 | 6.5% | 3.0%(+3.54)#28 | 3.8%(+2.68)#5,476 |
| 29. | 03285 | 6.5% | 3.0%(+3.51)#29 | 3.8%(+2.64)#5,535 |
| 30. | 03864 | 6.4% | 3.0%(+3.49)#30 | 3.8%(+2.63)#5,561 |
| 31. | 03836 | 6.4% | 3.0%(+3.44)#31 | 3.8%(+2.58)#5,637 |
| 32. | 03282 | 6.4% | 3.0%(+3.41)#32 | 3.8%(+2.55)#5,689 |
| 33. | 03782 | 6.2% | 3.0%(+3.28)#33 | 3.8%(+2.42)#5,921 |
| 34. | 03227 | 6.1% | 3.0%(+3.10)#34 | 3.8%(+2.24)#6,219 |
| 35. | 03846 | 6.0% | 3.0%(+3.02)#35 | 3.8%(+2.16)#6,376 |
| 36. | 03770 | 6.0% | 3.0%(+3.01)#36 | 3.8%(+2.14)#6,417 |
| 37. | 03084 | 5.9% | 3.0%(+2.99)#37 | 3.8%(+2.13)#6,443 |
| 38. | 03226 | 5.9% | 3.0%(+2.96)#38 | 3.8%(+2.09)#6,503 |
| 39. | 03872 | 5.9% | 3.0%(+2.94)#39 | 3.8%(+2.08)#6,538 |
| 40. | 03745 | 5.8% | 3.0%(+2.86)#40 | 3.8%(+2.00)#6,668 |
| 41. | 03842 | 5.8% | 3.0%(+2.83)#41 | 3.8%(+1.96)#6,744 |
| 42. | 03290 | 5.6% | 3.0%(+2.67)#42 | 3.8%(+1.81)#7,045 |
| 43. | 03456 | 5.3% | 3.0%(+2.35)#43 | 3.8%(+1.49)#7,804 |
| 44. | 03241 | 5.1% | 3.0%(+2.16)#44 | 3.8%(+1.30)#8,296 |
| 45. | 03819 | 5.1% | 3.0%(+2.11)#45 | 3.8%(+1.25)#8,426 |
| 46. | 03595 | 5.1% | 3.0%(+2.11)#46 | 3.8%(+1.24)#8,431 |
| 47. | 03809 | 5.0% | 3.0%(+2.09)#47 | 3.8%(+1.22)#8,480 |
| 48. | 03841 | 5.0% | 3.0%(+2.08)#48 | 3.8%(+1.22)#8,508 |
| 49. | 03049 | 5.0% | 3.0%(+2.00)#49 | 3.8%(+1.14)#8,725 |
| 50. | 03262 | 5.0% | 3.0%(+2.00)#50 | 3.8%(+1.13)#8,729 |
| 51. | 03743 | 4.9% | 3.0%(+1.98)#51 | 3.8%(+1.12)#8,778 |
| 52. | 03853 | 4.8% | 3.0%(+1.87)#52 | 3.8%(+1.01)#9,093 |
| 53. | 03779 | 4.7% | 3.0%(+1.79)#53 | 3.8%(+0.923)#9,350 |
| 54. | 03257 | 4.7% | 3.0%(+1.72)#54 | 3.8%(+0.858)#9,554 |
| 55. | 03216 | 4.6% | 3.0%(+1.65)#55 | 3.8%(+0.789)#9,772 |
| 56. | 03741 | 4.6% | 3.0%(+1.64)#56 | 3.8%(+0.782)#9,787 |
| 57. | 03851 | 4.5% | 3.0%(+1.59)#57 | 3.8%(+0.732)#9,928 |
| 58. | 03811 | 4.5% | 3.0%(+1.57)#58 | 3.8%(+0.706)#10,017 |
| 59. | 03254 | 4.5% | 3.0%(+1.50)#59 | 3.8%(+0.634)#10,254 |
| 60. | 03031 | 4.4% | 3.0%(+1.45)#60 | 3.8%(+0.583)#10,440 |
| 61. | 03057 | 4.3% | 3.0%(+1.37)#61 | 3.8%(+0.506)#10,727 |
| 62. | 03840 | 4.3% | 3.0%(+1.32)#62 | 3.8%(+0.463)#10,876 |
| 63. | 03110 | 4.3% | 3.0%(+1.30)#63 | 3.8%(+0.434)#10,991 |
| 64. | 03457 | 4.2% | 3.0%(+1.23)#64 | 3.8%(+0.371)#11,204 |
| 65. | 03598 | 4.2% | 3.0%(+1.21)#65 | 3.8%(+0.349)#11,274 |
| 66. | 03830 | 4.2% | 3.0%(+1.20)#66 | 3.8%(+0.335)#11,338 |
| 67. | 03442 | 4.1% | 3.0%(+1.13)#67 | 3.8%(+0.270)#11,572 |
| 68. | 03224 | 4.1% | 3.0%(+1.10)#68 | 3.8%(+0.238)#11,699 |
| 69. | 03245 | 4.0% | 3.0%(+1.07)#69 | 3.8%(+0.211)#11,806 |
| 70. | 03885 | 4.0% | 3.0%(+1.05)#70 | 3.8%(+0.185)#11,914 |
| 71. | 03087 | 4.0% | 3.0%(+0.999)#71 | 3.8%(+0.136)#12,118 |
| 72. | 03753 | 3.9% | 3.0%(+0.985)#72 | 3.8%(+0.123)#12,186 |
| 73. | 03106 | 3.9% | 3.0%(+0.927)#73 | 3.8%(+0.065)#12,407 |
| 74. | 03458 | 3.9% | 3.0%(+0.920)#74 | 3.8%(+0.058)#12,443 |
| 75. | 03467 | 3.8% | 3.0%(+0.887)#75 | 3.8%(+0.025)#12,576 |
| 76. | 03801 | 3.8% | 3.0%(+0.883)#76 | 3.8%(+0.021)#12,595 |
| 77. | 03307 | 3.8% | 3.0%(+0.868)#77 | 3.8%(+0.006)#12,664 |
| 78. | 03827 | 3.8% | 3.0%(+0.862)#78 | 3.8%(-0.000)#12,687 |
| 79. | 03273 | 3.8% | 3.0%(+0.842)#79 | 3.8%(-0.020)#12,773 |
| 80. | 03768 | 3.8% | 3.0%(+0.835)#80 | 3.8%(-0.027)#12,799 |
| 81. | 03584 | 3.8% | 3.0%(+0.825)#81 | 3.8%(-0.037)#12,840 |
| 82. | 03449 | 3.8% | 3.0%(+0.808)#82 | 3.8%(-0.054)#12,909 |
| 83. | 03581 | 3.8% | 3.0%(+0.807)#83 | 3.8%(-0.055)#12,916 |
| 84. | 03225 | 3.7% | 3.0%(+0.773)#84 | 3.8%(-0.089)#13,074 |
| 85. | 03304 | 3.7% | 3.0%(+0.763)#85 | 3.8%(-0.099)#13,110 |
| 86. | 03101 | 3.7% | 3.0%(+0.728)#86 | 3.8%(-0.134)#13,255 |
| 87. | 03445 | 3.7% | 3.0%(+0.721)#87 | 3.8%(-0.141)#13,280 |
| 88. | 03043 | 3.7% | 3.0%(+0.705)#88 | 3.8%(-0.157)#13,349 |
| 89. | 03237 | 3.7% | 3.0%(+0.697)#89 | 3.8%(-0.165)#13,385 |
| 90. | 03849 | 3.6% | 3.0%(+0.679)#90 | 3.8%(-0.183)#13,466 |
| 91. | 03048 | 3.6% | 3.0%(+0.614)#91 | 3.8%(-0.248)#13,734 |
| 92. | 03857 | 3.6% | 3.0%(+0.613)#92 | 3.8%(-0.249)#13,739 |
| 93. | 03440 | 3.6% | 3.0%(+0.611)#93 | 3.8%(-0.251)#13,740 |
| 94. | 03833 | 3.5% | 3.0%(+0.509)#94 | 3.8%(-0.353)#14,199 |
| 95. | 03748 | 3.4% | 3.0%(+0.465)#95 | 3.8%(-0.397)#14,397 |
| 96. | 03036 | 3.4% | 3.0%(+0.464)#96 | 3.8%(-0.398)#14,398 |
| 97. | 03258 | 3.4% | 3.0%(+0.461)#97 | 3.8%(-0.401)#14,410 |
| 98. | 03076 | 3.4% | 3.0%(+0.454)#98 | 3.8%(-0.409)#14,452 |
| 99. | 03218 | 3.4% | 3.0%(+0.441)#99 | 3.8%(-0.421)#14,507 |
| 100. | 03818 | 3.4% | 3.0%(+0.437)#100 | 3.8%(-0.426)#14,527 |
Common Questions
What are the Top 10 Zip Codes with the Highest Percentage of Self-Employed / Incorporated in New Hampshire?
Top 10 Zip Codes with the Highest Percentage of Self-Employed / Incorporated in New Hampshire are:
What zip code has the Highest Percentage of Self-Employed / Incorporated in New Hampshire?
03847 has the Highest Percentage of Self-Employed / Incorporated in New Hampshire with 80.8%.
What is the Percentage of Self-Employed / Incorporated in the State of New Hampshire?
Percentage of Self-Employed / Incorporated in New Hampshire is 3.0%.
What is the Percentage of Self-Employed / Incorporated in the United States?
Percentage of Self-Employed / Incorporated in the United States is 3.8%.