Zip Codes with the Highest Percentage of Population Employed in Sales & Related in New Hampshire
RELATED REPORTS & OPTIONS
Sales & Related
New Hampshire
Compare Zip Codes
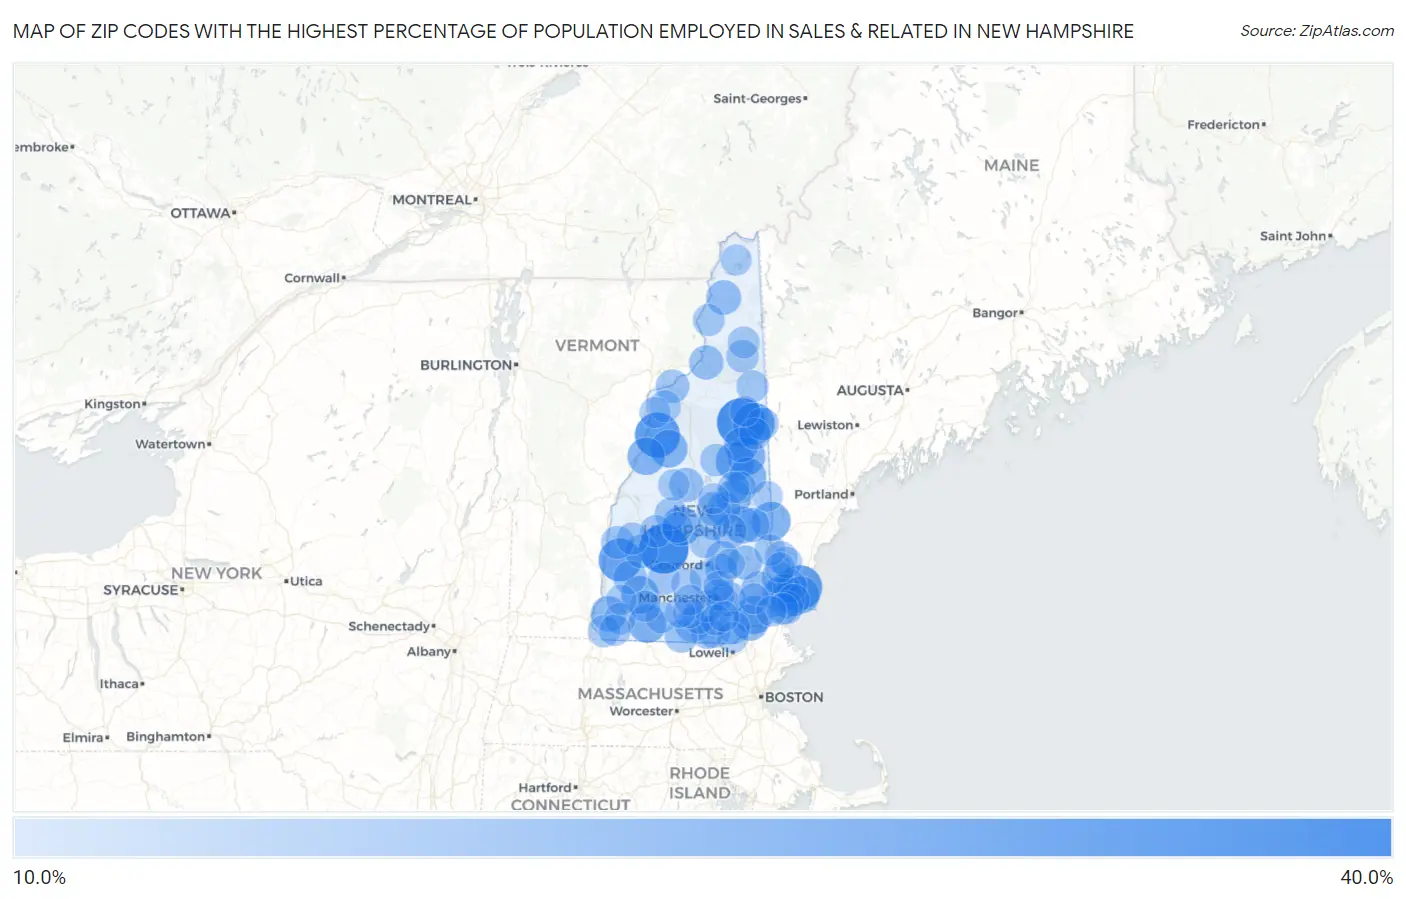
Map of Zip Codes with the Highest Percentage of Population Employed in Sales & Related in New Hampshire
10.0%
40.0%
Zip Codes with the Highest Percentage of Population Employed in Sales & Related in New Hampshire
| Zip Code | % Employed | vs State | vs National | |
| 1. | 03273 | 32.5% | 10.3%(+22.2)#1 | 9.6%(+22.9)#329 |
| 2. | 03838 | 31.3% | 10.3%(+21.0)#2 | 9.6%(+21.7)#366 |
| 3. | 03780 | 27.2% | 10.3%(+16.8)#3 | 9.6%(+17.6)#513 |
| 4. | 03854 | 26.5% | 10.3%(+16.1)#4 | 9.6%(+16.9)#544 |
| 5. | 03601 | 24.6% | 10.3%(+14.2)#5 | 9.6%(+15.0)#678 |
| 6. | 03845 | 23.6% | 10.3%(+13.3)#6 | 9.6%(+14.0)#749 |
| 7. | 03231 | 20.3% | 10.3%(+9.92)#7 | 9.6%(+10.7)#1,120 |
| 8. | 03852 | 20.0% | 10.3%(+9.65)#8 | 9.6%(+10.4)#1,150 |
| 9. | 03886 | 19.8% | 10.3%(+9.46)#9 | 9.6%(+10.2)#1,180 |
| 10. | 03452 | 19.2% | 10.3%(+8.89)#10 | 9.6%(+9.64)#1,290 |
| 11. | 03826 | 19.2% | 10.3%(+8.82)#11 | 9.6%(+9.58)#1,304 |
| 12. | 03875 | 19.1% | 10.3%(+8.71)#12 | 9.6%(+9.46)#1,329 |
| 13. | 03279 | 18.6% | 10.3%(+8.28)#13 | 9.6%(+9.03)#1,415 |
| 14. | 03457 | 18.5% | 10.3%(+8.16)#14 | 9.6%(+8.91)#1,435 |
| 15. | 03777 | 18.4% | 10.3%(+8.02)#15 | 9.6%(+8.77)#1,468 |
| 16. | 03814 | 18.2% | 10.3%(+7.90)#16 | 9.6%(+8.65)#1,502 |
| 17. | 03870 | 17.8% | 10.3%(+7.44)#17 | 9.6%(+8.19)#1,619 |
| 18. | 03809 | 17.4% | 10.3%(+7.04)#18 | 9.6%(+7.79)#1,723 |
| 19. | 03811 | 17.2% | 10.3%(+6.87)#19 | 9.6%(+7.62)#1,767 |
| 20. | 03462 | 15.9% | 10.3%(+5.57)#20 | 9.6%(+6.32)#2,271 |
| 21. | 03885 | 15.8% | 10.3%(+5.49)#21 | 9.6%(+6.24)#2,318 |
| 22. | 03840 | 15.6% | 10.3%(+5.28)#22 | 9.6%(+6.03)#2,409 |
| 23. | 03853 | 15.5% | 10.3%(+5.16)#23 | 9.6%(+5.91)#2,472 |
| 24. | 03818 | 15.1% | 10.3%(+4.73)#24 | 9.6%(+5.48)#2,690 |
| 25. | 03042 | 15.0% | 10.3%(+4.65)#25 | 9.6%(+5.40)#2,735 |
| 26. | 03576 | 15.0% | 10.3%(+4.62)#26 | 9.6%(+5.37)#2,758 |
| 27. | 03055 | 14.7% | 10.3%(+4.35)#27 | 9.6%(+5.10)#2,946 |
| 28. | 03584 | 14.7% | 10.3%(+4.33)#28 | 9.6%(+5.08)#2,958 |
| 29. | 03264 | 14.6% | 10.3%(+4.25)#29 | 9.6%(+5.00)#3,017 |
| 30. | 03855 | 14.5% | 10.3%(+4.19)#30 | 9.6%(+4.94)#3,057 |
| 31. | 03862 | 14.5% | 10.3%(+4.19)#31 | 9.6%(+4.94)#3,063 |
| 32. | 03261 | 14.5% | 10.3%(+4.11)#32 | 9.6%(+4.86)#3,112 |
| 33. | 03249 | 14.3% | 10.3%(+3.95)#33 | 9.6%(+4.70)#3,241 |
| 34. | 03032 | 14.2% | 10.3%(+3.88)#34 | 9.6%(+4.64)#3,308 |
| 35. | 03837 | 14.2% | 10.3%(+3.82)#35 | 9.6%(+4.57)#3,350 |
| 36. | 03246 | 14.2% | 10.3%(+3.81)#36 | 9.6%(+4.56)#3,355 |
| 37. | 03801 | 14.1% | 10.3%(+3.74)#37 | 9.6%(+4.49)#3,408 |
| 38. | 03561 | 13.8% | 10.3%(+3.46)#38 | 9.6%(+4.21)#3,644 |
| 39. | 03456 | 13.7% | 10.3%(+3.35)#39 | 9.6%(+4.10)#3,748 |
| 40. | 03752 | 13.6% | 10.3%(+3.28)#40 | 9.6%(+4.03)#3,819 |
| 41. | 03064 | 13.5% | 10.3%(+3.18)#41 | 9.6%(+3.93)#3,915 |
| 42. | 03842 | 13.5% | 10.3%(+3.17)#42 | 9.6%(+3.92)#3,922 |
| 43. | 03258 | 13.4% | 10.3%(+3.06)#43 | 9.6%(+3.81)#4,030 |
| 44. | 03109 | 13.4% | 10.3%(+3.01)#44 | 9.6%(+3.76)#4,087 |
| 45. | 03743 | 13.1% | 10.3%(+2.78)#45 | 9.6%(+3.53)#4,355 |
| 46. | 03304 | 13.1% | 10.3%(+2.73)#46 | 9.6%(+3.48)#4,407 |
| 47. | 03063 | 13.0% | 10.3%(+2.65)#47 | 9.6%(+3.41)#4,487 |
| 48. | 03048 | 13.0% | 10.3%(+2.64)#48 | 9.6%(+3.39)#4,504 |
| 49. | 03031 | 12.8% | 10.3%(+2.41)#49 | 9.6%(+3.16)#4,817 |
| 50. | 03230 | 12.7% | 10.3%(+2.35)#50 | 9.6%(+3.10)#4,888 |
| 51. | 03257 | 12.7% | 10.3%(+2.34)#51 | 9.6%(+3.09)#4,899 |
| 52. | 03275 | 12.6% | 10.3%(+2.27)#52 | 9.6%(+3.02)#4,995 |
| 53. | 03087 | 12.6% | 10.3%(+2.26)#53 | 9.6%(+3.01)#5,002 |
| 54. | 03824 | 12.5% | 10.3%(+2.11)#54 | 9.6%(+2.86)#5,246 |
| 55. | 03813 | 12.4% | 10.3%(+2.10)#55 | 9.6%(+2.85)#5,259 |
| 56. | 03773 | 12.4% | 10.3%(+2.09)#56 | 9.6%(+2.84)#5,274 |
| 57. | 03259 | 12.4% | 10.3%(+2.06)#57 | 9.6%(+2.81)#5,325 |
| 58. | 03570 | 12.3% | 10.3%(+1.99)#58 | 9.6%(+2.75)#5,420 |
| 59. | 03878 | 12.3% | 10.3%(+1.92)#59 | 9.6%(+2.67)#5,551 |
| 60. | 03871 | 12.2% | 10.3%(+1.89)#60 | 9.6%(+2.64)#5,608 |
| 61. | 03110 | 12.2% | 10.3%(+1.87)#61 | 9.6%(+2.63)#5,631 |
| 62. | 03244 | 12.2% | 10.3%(+1.82)#62 | 9.6%(+2.57)#5,736 |
| 63. | 03816 | 12.1% | 10.3%(+1.75)#63 | 9.6%(+2.50)#5,883 |
| 64. | 03441 | 12.0% | 10.3%(+1.65)#64 | 9.6%(+2.40)#6,046 |
| 65. | 03220 | 12.0% | 10.3%(+1.63)#65 | 9.6%(+2.38)#6,092 |
| 66. | 03581 | 12.0% | 10.3%(+1.62)#66 | 9.6%(+2.38)#6,107 |
| 67. | 03588 | 11.9% | 10.3%(+1.51)#67 | 9.6%(+2.26)#6,313 |
| 68. | 03585 | 11.8% | 10.3%(+1.50)#68 | 9.6%(+2.25)#6,328 |
| 69. | 03844 | 11.8% | 10.3%(+1.45)#69 | 9.6%(+2.20)#6,420 |
| 70. | 03590 | 11.7% | 10.3%(+1.36)#70 | 9.6%(+2.11)#6,600 |
| 71. | 03860 | 11.6% | 10.3%(+1.25)#71 | 9.6%(+2.00)#6,797 |
| 72. | 03446 | 11.5% | 10.3%(+1.17)#72 | 9.6%(+1.92)#6,982 |
| 73. | 03458 | 11.5% | 10.3%(+1.13)#73 | 9.6%(+1.88)#7,072 |
| 74. | 03470 | 11.5% | 10.3%(+1.11)#74 | 9.6%(+1.87)#7,111 |
| 75. | 03057 | 11.5% | 10.3%(+1.10)#75 | 9.6%(+1.86)#7,132 |
| 76. | 03850 | 11.4% | 10.3%(+1.08)#76 | 9.6%(+1.83)#7,189 |
| 77. | 03104 | 11.4% | 10.3%(+1.08)#77 | 9.6%(+1.83)#7,203 |
| 78. | 03869 | 11.3% | 10.3%(+0.937)#78 | 9.6%(+1.69)#7,516 |
| 79. | 03076 | 11.2% | 10.3%(+0.836)#79 | 9.6%(+1.59)#7,744 |
| 80. | 03740 | 11.1% | 10.3%(+0.765)#80 | 9.6%(+1.52)#7,912 |
| 81. | 03867 | 11.1% | 10.3%(+0.754)#81 | 9.6%(+1.51)#7,954 |
| 82. | 03450 | 11.1% | 10.3%(+0.741)#82 | 9.6%(+1.49)#7,985 |
| 83. | 03052 | 11.1% | 10.3%(+0.731)#83 | 9.6%(+1.48)#8,014 |
| 84. | 03241 | 11.1% | 10.3%(+0.723)#84 | 9.6%(+1.47)#8,030 |
| 85. | 03224 | 11.0% | 10.3%(+0.684)#85 | 9.6%(+1.43)#8,129 |
| 86. | 03253 | 10.8% | 10.3%(+0.488)#86 | 9.6%(+1.24)#8,616 |
| 87. | 03053 | 10.8% | 10.3%(+0.430)#87 | 9.6%(+1.18)#8,788 |
| 88. | 03592 | 10.7% | 10.3%(+0.383)#88 | 9.6%(+1.13)#8,901 |
| 89. | 03044 | 10.7% | 10.3%(+0.368)#89 | 9.6%(+1.12)#8,949 |
| 90. | 03216 | 10.6% | 10.3%(+0.303)#90 | 9.6%(+1.05)#9,131 |
| 91. | 03281 | 10.6% | 10.3%(+0.243)#91 | 9.6%(+0.995)#9,298 |
| 92. | 03070 | 10.5% | 10.3%(+0.186)#92 | 9.6%(+0.937)#9,444 |
| 93. | 03830 | 10.4% | 10.3%(+0.034)#93 | 9.6%(+0.786)#9,870 |
| 94. | 03827 | 10.4% | 10.3%(+0.029)#94 | 9.6%(+0.780)#9,883 |
| 95. | 03082 | 10.3% | 10.3%(-0.002)#95 | 9.6%(+0.750)#9,972 |
| 96. | 03106 | 10.3% | 10.3%(-0.027)#96 | 9.6%(+0.724)#10,045 |
| 97. | 03431 | 10.3% | 10.3%(-0.064)#97 | 9.6%(+0.687)#10,165 |
| 98. | 03846 | 10.2% | 10.3%(-0.100)#98 | 9.6%(+0.652)#10,261 |
| 99. | 03820 | 10.2% | 10.3%(-0.159)#99 | 9.6%(+0.592)#10,470 |
| 100. | 03234 | 10.0% | 10.3%(-0.338)#100 | 9.6%(+0.413)#10,972 |
Common Questions
What are the Top 10 Zip Codes with the Highest Percentage of Population Employed in Sales & Related in New Hampshire?
Top 10 Zip Codes with the Highest Percentage of Population Employed in Sales & Related in New Hampshire are:
What zip code has the Highest Percentage of Population Employed in Sales & Related in New Hampshire?
03273 has the Highest Percentage of Population Employed in Sales & Related in New Hampshire with 32.5%.
What is the Percentage of Population Employed in Sales & Related in the State of New Hampshire?
Percentage of Population Employed in Sales & Related in New Hampshire is 10.3%.
What is the Percentage of Population Employed in Sales & Related in the United States?
Percentage of Population Employed in Sales & Related in the United States is 9.6%.