Zip Codes with the Highest Percentage of Renter-Occupied Units in Rochester, NH
RELATED REPORTS & OPTIONS
Highest Renter-Occupied
Rochester
Compare Zip Codes
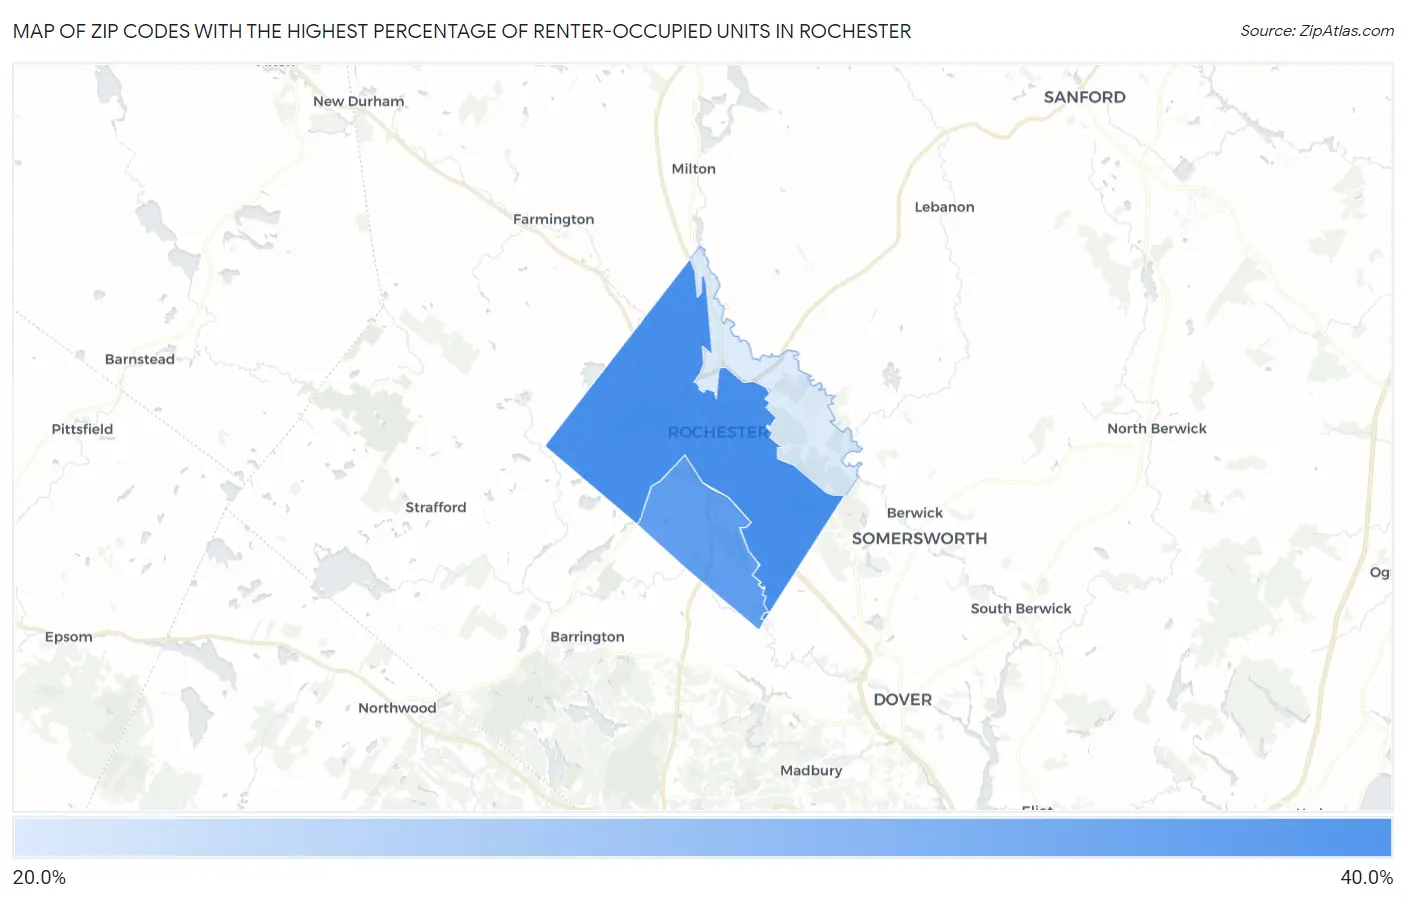
Map of Zip Codes with the Highest Percentage of Renter-Occupied Units in Rochester
0.0%
40.0%
Zip Codes with the Highest Percentage of Renter-Occupied Units in Rochester, NH
| Zip Code | % Renter-Occupied | vs State | vs National | |
| 1. | 03867 | 37.3% | 27.7%(+9.54)#31 | 35.2%(+2.09)#6,358 |
| 2. | 03839 | 34.6% | 27.7%(+6.89)#37 | 35.2%(-0.561)#7,549 |
| 3. | 03868 | 21.8% | 27.7%(-5.89)#80 | 35.2%(-13.3)#16,503 |
1
Common Questions
What are the Top Zip Codes with the Highest Percentage of Renter-Occupied Units in Rochester, NH?
Top Zip Codes with the Highest Percentage of Renter-Occupied Units in Rochester, NH are:
What zip code has the Highest Percentage of Renter-Occupied Units in Rochester, NH?
03867 has the Highest Percentage of Renter-Occupied Units in Rochester, NH with 37.3%.
What is the Percentage of Renter-Occupied Units in Rochester, NH?
Percentage of Renter-Occupied Units in Rochester is 34.0%.
What is the Percentage of Renter-Occupied Units in New Hampshire?
Percentage of Renter-Occupied Units in New Hampshire is 27.7%.
What is the Percentage of Renter-Occupied Units in the United States?
Percentage of Renter-Occupied Units in the United States is 35.2%.