Zip Codes with the Highest Percentage of Population Employed in Transportation in Manchester, NH

RELATED REPORTS & OPTIONS

Transportation
Population
Families and Households
Female Fertility
Female Fertility (Unmarried)
Race (Community Size)
Race (Percentage)
Ancestry (Community Size)
AfricanAlbanianAmericanArabArmenianAustrianBarbadianBelgianBhutaneseBlackfeetBrazilianBritishBritish West IndianBulgarianBurmeseCanadianCape VerdeanCentral AmericanCentral American IndianCherokeeColombianCosta RicanCroatianCubanCzechDanishDominicanDutchEastern EuropeanEcuadorianEnglishEuropeanFinnishFrenchFrench American IndianFrench CanadianGermanGreekGuamanian / ChamorroGuatemalanHaitianHonduranHopiHungarianIcelanderIndian (Asian)IranianIrishIroquoisItalianJamaicanJapaneseKenyanKoreanLaotianLebaneseLithuanianMalaysianMexicanMexican American IndianNative HawaiianNicaraguanNigerianNorthern EuropeanNorwegianPakistaniPeruvianPolishPortuguesePuerto RicanRomanianRussianSalvadoranScandinavianScotch-IrishScottishSerbianSlavicSlovakSloveneSouth AmericanSpaniardSpanishSri LankanSubsaharan AfricanSudaneseSwedishSwissThaiTurkishUkrainianUruguayanVenezuelanVietnameseWelshWest IndianYugoslavian
Ancestry (Percentage)
AfricanAlbanianAmericanArabArmenianAustrianBarbadianBelgianBhutaneseBlackfeetBrazilianBritishBritish West IndianBulgarianBurmeseCanadianCape VerdeanCentral AmericanCentral American IndianCherokeeColombianCosta RicanCroatianCubanCzechDanishDominicanDutchEastern EuropeanEcuadorianEnglishEuropeanFinnishFrenchFrench American IndianFrench CanadianGermanGreekGuamanian / ChamorroGuatemalanHaitianHonduranHopiHungarianIcelanderIndian (Asian)IranianIrishIroquoisItalianJamaicanJapaneseKenyanKoreanLaotianLebaneseLithuanianMalaysianMexicanMexican American IndianNative HawaiianNicaraguanNigerianNorthern EuropeanNorwegianPakistaniPeruvianPolishPortuguesePuerto RicanRomanianRussianSalvadoranScandinavianScotch-IrishScottishSerbianSlavicSlovakSloveneSouth AmericanSpaniardSpanishSri LankanSubsaharan AfricanSudaneseSwedishSwissThaiTurkishUkrainianUruguayanVenezuelanVietnameseWelshWest IndianYugoslavian
Immigrant Origin (Total)
Immigrant Origin (Percentage)
Income
Income (Families)
Income (Households)
Poverty
Poverty (Families)
Unemployment
Employment Occupations
Employment Industries
Employer Class
Commute Time
Commute Means
School Enrollment
Education by Degree Field
Occupancy
Finances
Physical Characteristics
Manchester
Compare Zip Codes
Comparison Subject

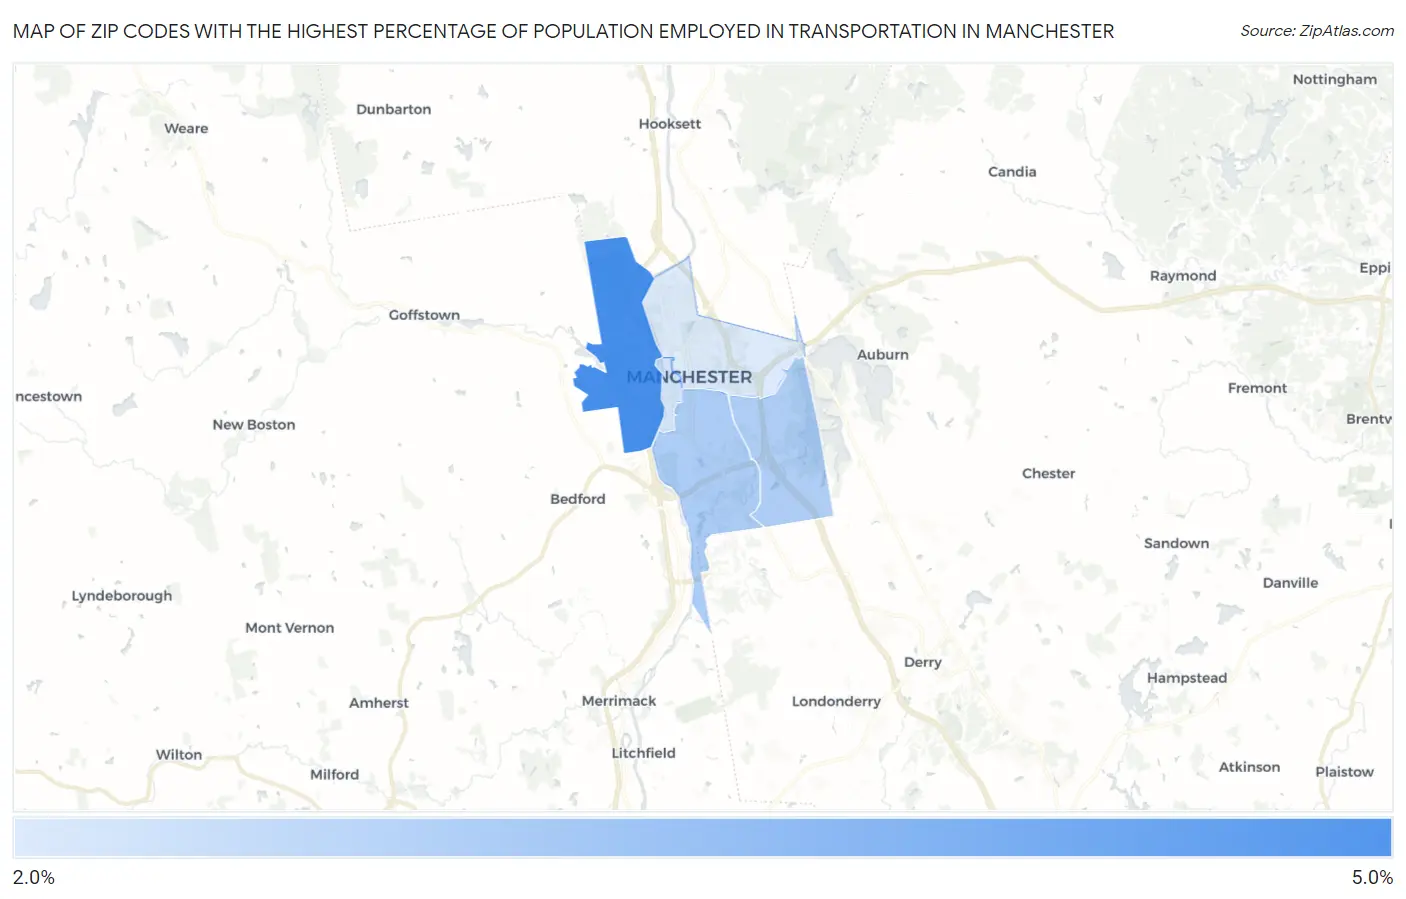
Map of Zip Codes with the Highest Percentage of Population Employed in Transportation in Manchester

0.0%
5.0%
Zip Codes with the Highest Percentage of Population Employed in Transportation in Manchester Map

Zip Codes with the Highest Percentage of Population Employed in Transportation in Manchester, NH

Zip Code % Employed vs State vs National
1.031024.9%3.0%(+1.89)#293.8%(+1.06)#10,791
2.031033.4%3.0%(+0.383)#793.8%(-0.450)#17,490
3.031093.3%3.0%(+0.343)#823.8%(-0.490)#17,681
4.031012.8%3.0%(-0.186)#1043.8%(-1.02)#20,167
5.031042.6%3.0%(-0.355)#1133.8%(-1.19)#20,984

Common Questions

What are the Top 3 Zip Codes with the Highest Percentage of Population Employed in Transportation in Manchester, NH?
Top 3 Zip Codes with the Highest Percentage of Population Employed in Transportation in Manchester, NH are:
#1
4.9%
#2
3.4%
#3
3.3%
What zip code has the Highest Percentage of Population Employed in Transportation in Manchester, NH?
03102 has the Highest Percentage of Population Employed in Transportation in Manchester, NH with 4.9%.
What is the Percentage of Population Employed in Transportation in Manchester, NH?
Percentage of Population Employed in Transportation in Manchester is 3.6%.
What is the Percentage of Population Employed in Transportation in New Hampshire?
Percentage of Population Employed in Transportation in New Hampshire is 3.0%.
What is the Percentage of Population Employed in Transportation in the United States?
Percentage of Population Employed in Transportation in the United States is 3.8%.