Cities with the Highest Percentage of Population Employed in Personal Care and Service in New Hampshire
RELATED REPORTS & OPTIONS
Personal Care and Service
New Hampshire
Compare Cities
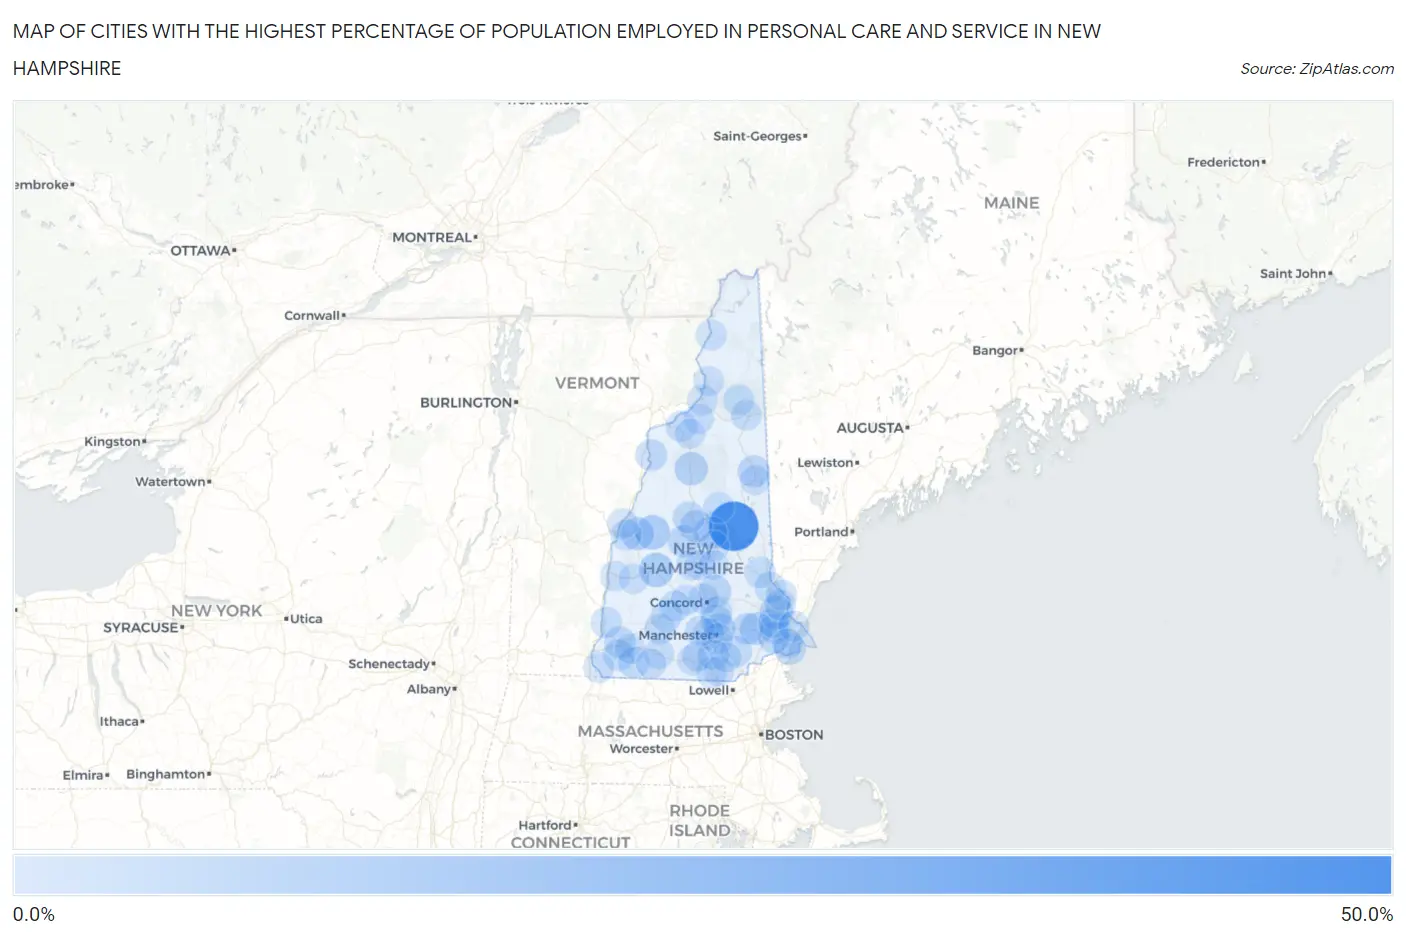
Map of Cities with the Highest Percentage of Population Employed in Personal Care and Service in New Hampshire
0.0%
50.0%
Cities with the Highest Percentage of Population Employed in Personal Care and Service in New Hampshire
| City | % Employed | vs State | vs National | |
| 1. | Melvin Village | 45.8% | 2.5%(+43.4)#1 | 2.6%(+43.3)#51 |
| 2. | Canaan | 10.2% | 2.5%(+7.71)#2 | 2.6%(+7.61)#902 |
| 3. | New London | 10.0% | 2.5%(+7.51)#3 | 2.6%(+7.41)#937 |
| 4. | Klondike Corner | 8.8% | 2.5%(+6.33)#4 | 2.6%(+6.23)#1,205 |
| 5. | Durham | 8.0% | 2.5%(+5.52)#5 | 2.6%(+5.42)#1,441 |
| 6. | Lincoln | 7.3% | 2.5%(+4.82)#6 | 2.6%(+4.72)#1,703 |
| 7. | Enfield | 6.9% | 2.5%(+4.40)#7 | 2.6%(+4.30)#1,910 |
| 8. | Epping | 6.3% | 2.5%(+3.85)#8 | 2.6%(+3.75)#2,233 |
| 9. | Meredith | 5.5% | 2.5%(+3.01)#9 | 2.6%(+2.91)#2,948 |
| 10. | Loudon | 5.4% | 2.5%(+2.93)#10 | 2.6%(+2.83)#3,015 |
| 11. | Bristol | 4.8% | 2.5%(+2.31)#11 | 2.6%(+2.21)#3,745 |
| 12. | Ashland | 4.7% | 2.5%(+2.25)#12 | 2.6%(+2.15)#3,839 |
| 13. | North Conway | 4.6% | 2.5%(+2.10)#13 | 2.6%(+2.00)#4,059 |
| 14. | Hampton Beach | 4.3% | 2.5%(+1.82)#14 | 2.6%(+1.72)#4,509 |
| 15. | Keene | 4.3% | 2.5%(+1.81)#15 | 2.6%(+1.71)#4,531 |
| 16. | Exeter | 4.0% | 2.5%(+1.56)#16 | 2.6%(+1.46)#5,000 |
| 17. | Raymond | 3.9% | 2.5%(+1.49)#17 | 2.6%(+1.39)#5,158 |
| 18. | Woodsville | 3.9% | 2.5%(+1.41)#18 | 2.6%(+1.31)#5,333 |
| 19. | Plymouth | 3.8% | 2.5%(+1.37)#19 | 2.6%(+1.27)#5,448 |
| 20. | Suncook | 3.6% | 2.5%(+1.14)#20 | 2.6%(+1.04)#6,055 |
| 21. | West Swanzey | 3.6% | 2.5%(+1.10)#21 | 2.6%(+1.00)#6,166 |
| 22. | Derry | 3.3% | 2.5%(+0.844)#22 | 2.6%(+0.744)#6,985 |
| 23. | Hillsborough | 3.2% | 2.5%(+0.751)#23 | 2.6%(+0.651)#7,283 |
| 24. | Troy | 3.1% | 2.5%(+0.597)#24 | 2.6%(+0.497)#7,865 |
| 25. | South Hooksett | 3.0% | 2.5%(+0.493)#25 | 2.6%(+0.393)#8,271 |
| 26. | Newfields | 2.9% | 2.5%(+0.462)#26 | 2.6%(+0.362)#8,397 |
| 27. | Hooksett | 2.9% | 2.5%(+0.422)#27 | 2.6%(+0.321)#8,566 |
| 28. | Pinardville | 2.8% | 2.5%(+0.386)#28 | 2.6%(+0.286)#8,713 |
| 29. | Manchester | 2.8% | 2.5%(+0.355)#29 | 2.6%(+0.255)#8,846 |
| 30. | Center Sandwich | 2.7% | 2.5%(+0.265)#30 | 2.6%(+0.165)#9,260 |
| 31. | Rochester | 2.7% | 2.5%(+0.209)#31 | 2.6%(+0.109)#9,514 |
| 32. | Walpole | 2.6% | 2.5%(+0.184)#32 | 2.6%(+0.083)#9,625 |
| 33. | Lebanon | 2.6% | 2.5%(+0.093)#33 | 2.6%(-0.008)#10,077 |
| 34. | Littleton | 2.6% | 2.5%(+0.089)#34 | 2.6%(-0.011)#10,090 |
| 35. | Berlin | 2.5% | 2.5%(+0.084)#35 | 2.6%(-0.016)#10,118 |
| 36. | Henniker | 2.5% | 2.5%(+0.067)#36 | 2.6%(-0.034)#10,216 |
| 37. | Nashua | 2.5% | 2.5%(+0.065)#37 | 2.6%(-0.035)#10,223 |
| 38. | Laconia | 2.4% | 2.5%(-0.068)#38 | 2.6%(-0.169)#10,932 |
| 39. | Farmington | 2.3% | 2.5%(-0.168)#39 | 2.6%(-0.268)#11,475 |
| 40. | Newmarket | 2.3% | 2.5%(-0.191)#40 | 2.6%(-0.291)#11,609 |
| 41. | Dover | 2.2% | 2.5%(-0.291)#41 | 2.6%(-0.392)#12,121 |
| 42. | Portsmouth | 2.1% | 2.5%(-0.334)#42 | 2.6%(-0.435)#12,352 |
| 43. | Colebrook | 2.0% | 2.5%(-0.421)#43 | 2.6%(-0.522)#12,773 |
| 44. | Somersworth | 2.0% | 2.5%(-0.487)#44 | 2.6%(-0.587)#13,109 |
| 45. | Concord | 1.9% | 2.5%(-0.514)#45 | 2.6%(-0.615)#13,237 |
| 46. | Gorham | 1.9% | 2.5%(-0.577)#46 | 2.6%(-0.677)#13,595 |
| 47. | East Merrimack | 1.8% | 2.5%(-0.631)#47 | 2.6%(-0.731)#13,844 |
| 48. | Lancaster | 1.8% | 2.5%(-0.652)#48 | 2.6%(-0.753)#13,938 |
| 49. | Hinsdale | 1.8% | 2.5%(-0.667)#49 | 2.6%(-0.768)#14,011 |
| 50. | Contoocook | 1.8% | 2.5%(-0.710)#50 | 2.6%(-0.810)#14,239 |
| 51. | Milford | 1.7% | 2.5%(-0.725)#51 | 2.6%(-0.826)#14,311 |
| 52. | Antrim | 1.7% | 2.5%(-0.805)#52 | 2.6%(-0.906)#14,735 |
| 53. | Hampton | 1.5% | 2.5%(-0.941)#53 | 2.6%(-1.04)#15,427 |
| 54. | Amherst | 1.5% | 2.5%(-0.960)#54 | 2.6%(-1.06)#15,527 |
| 55. | Hanover | 1.5% | 2.5%(-0.973)#55 | 2.6%(-1.07)#15,597 |
| 56. | Franklin | 1.4% | 2.5%(-1.02)#56 | 2.6%(-1.12)#15,812 |
| 57. | Peterborough | 1.4% | 2.5%(-1.02)#57 | 2.6%(-1.12)#15,829 |
| 58. | Goffstown | 1.3% | 2.5%(-1.13)#58 | 2.6%(-1.23)#16,369 |
| 59. | Groveton | 1.3% | 2.5%(-1.20)#59 | 2.6%(-1.30)#16,676 |
| 60. | Marlborough | 0.94% | 2.5%(-1.53)#60 | 2.6%(-1.63)#18,177 |
| 61. | Hudson | 0.93% | 2.5%(-1.53)#61 | 2.6%(-1.63)#18,202 |
| 62. | Claremont | 0.91% | 2.5%(-1.55)#62 | 2.6%(-1.65)#18,275 |
| 63. | Whitefield | 0.90% | 2.5%(-1.56)#63 | 2.6%(-1.66)#18,311 |
| 64. | Londonderry | 0.87% | 2.5%(-1.59)#64 | 2.6%(-1.69)#18,442 |
| 65. | Tilton Northfield | 0.82% | 2.5%(-1.64)#65 | 2.6%(-1.75)#18,645 |
| 66. | Bethlehem | 0.80% | 2.5%(-1.67)#66 | 2.6%(-1.77)#18,738 |
| 67. | Conway | 0.73% | 2.5%(-1.73)#67 | 2.6%(-1.83)#18,963 |
| 68. | Newport | 0.70% | 2.5%(-1.77)#68 | 2.6%(-1.87)#19,115 |
| 69. | Jaffrey | 0.65% | 2.5%(-1.81)#69 | 2.6%(-1.91)#19,284 |
| 70. | Belmont | 0.16% | 2.5%(-2.30)#70 | 2.6%(-2.40)#20,426 |
1
Common Questions
What are the Top 10 Cities with the Highest Percentage of Population Employed in Personal Care and Service in New Hampshire?
Top 10 Cities with the Highest Percentage of Population Employed in Personal Care and Service in New Hampshire are:
#1
45.8%
#2
10.2%
#3
10.0%
#4
8.0%
#5
7.3%
#6
6.9%
#7
6.3%
#8
5.5%
#9
5.4%
#10
4.8%
What city has the Highest Percentage of Population Employed in Personal Care and Service in New Hampshire?
Melvin Village has the Highest Percentage of Population Employed in Personal Care and Service in New Hampshire with 45.8%.
What is the Percentage of Population Employed in Personal Care and Service in the State of New Hampshire?
Percentage of Population Employed in Personal Care and Service in New Hampshire is 2.5%.
What is the Percentage of Population Employed in Personal Care and Service in the United States?
Percentage of Population Employed in Personal Care and Service in the United States is 2.6%.