Zip Codes with the Highest Percentage of Population Employed in Arts, Entertainment & Recreation in Papillion, NE
RELATED REPORTS & OPTIONS
Arts, Entertainment & Recreation
Papillion
Compare Zip Codes
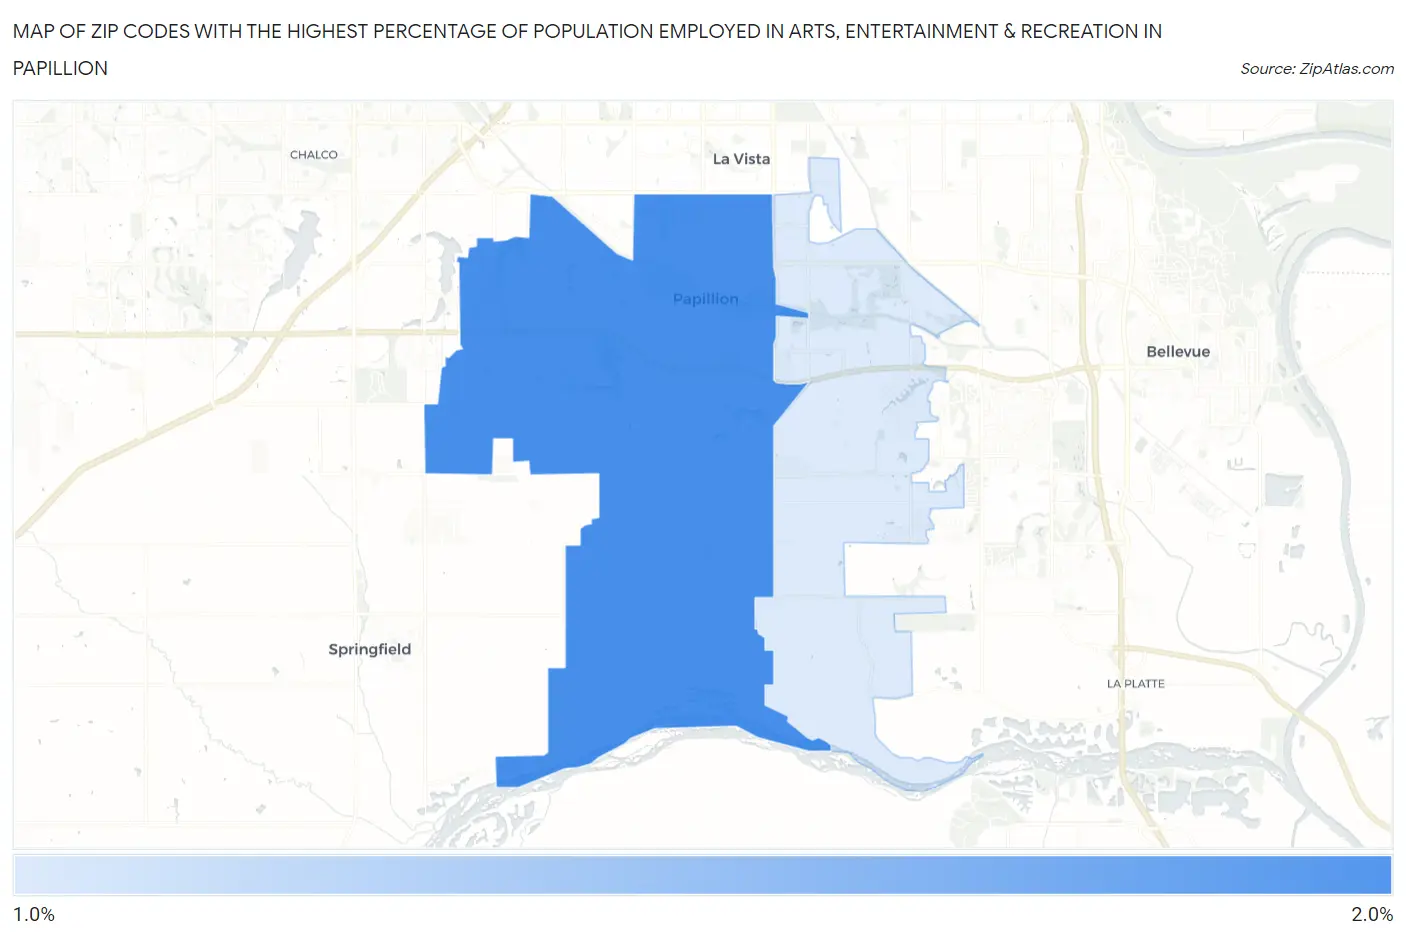
Map of Zip Codes with the Highest Percentage of Population Employed in Arts, Entertainment & Recreation in Papillion
0.0%
2.0%
Zip Codes with the Highest Percentage of Population Employed in Arts, Entertainment & Recreation in Papillion, NE
| Zip Code | % Employed | vs State | vs National | |
| 1. | 68046 | 1.9% | 1.6%(+0.294)#123 | 2.1%(-0.218)#10,584 |
| 2. | 68133 | 1.3% | 1.6%(-0.273)#179 | 2.1%(-0.784)#14,728 |
1
Common Questions
What are the Top Zip Codes with the Highest Percentage of Population Employed in Arts, Entertainment & Recreation in Papillion, NE?
Top Zip Codes with the Highest Percentage of Population Employed in Arts, Entertainment & Recreation in Papillion, NE are:
What zip code has the Highest Percentage of Population Employed in Arts, Entertainment & Recreation in Papillion, NE?
68046 has the Highest Percentage of Population Employed in Arts, Entertainment & Recreation in Papillion, NE with 1.9%.
What is the Percentage of Population Employed in Arts, Entertainment & Recreation in Papillion, NE?
Percentage of Population Employed in Arts, Entertainment & Recreation in Papillion is 1.9%.
What is the Percentage of Population Employed in Arts, Entertainment & Recreation in Nebraska?
Percentage of Population Employed in Arts, Entertainment & Recreation in Nebraska is 1.6%.
What is the Percentage of Population Employed in Arts, Entertainment & Recreation in the United States?
Percentage of Population Employed in Arts, Entertainment & Recreation in the United States is 2.1%.