Zip Codes with the Highest Percentage of Black / African American Population in Papillion, NE
RELATED REPORTS & OPTIONS
Black / African American
Papillion
Compare Zip Codes
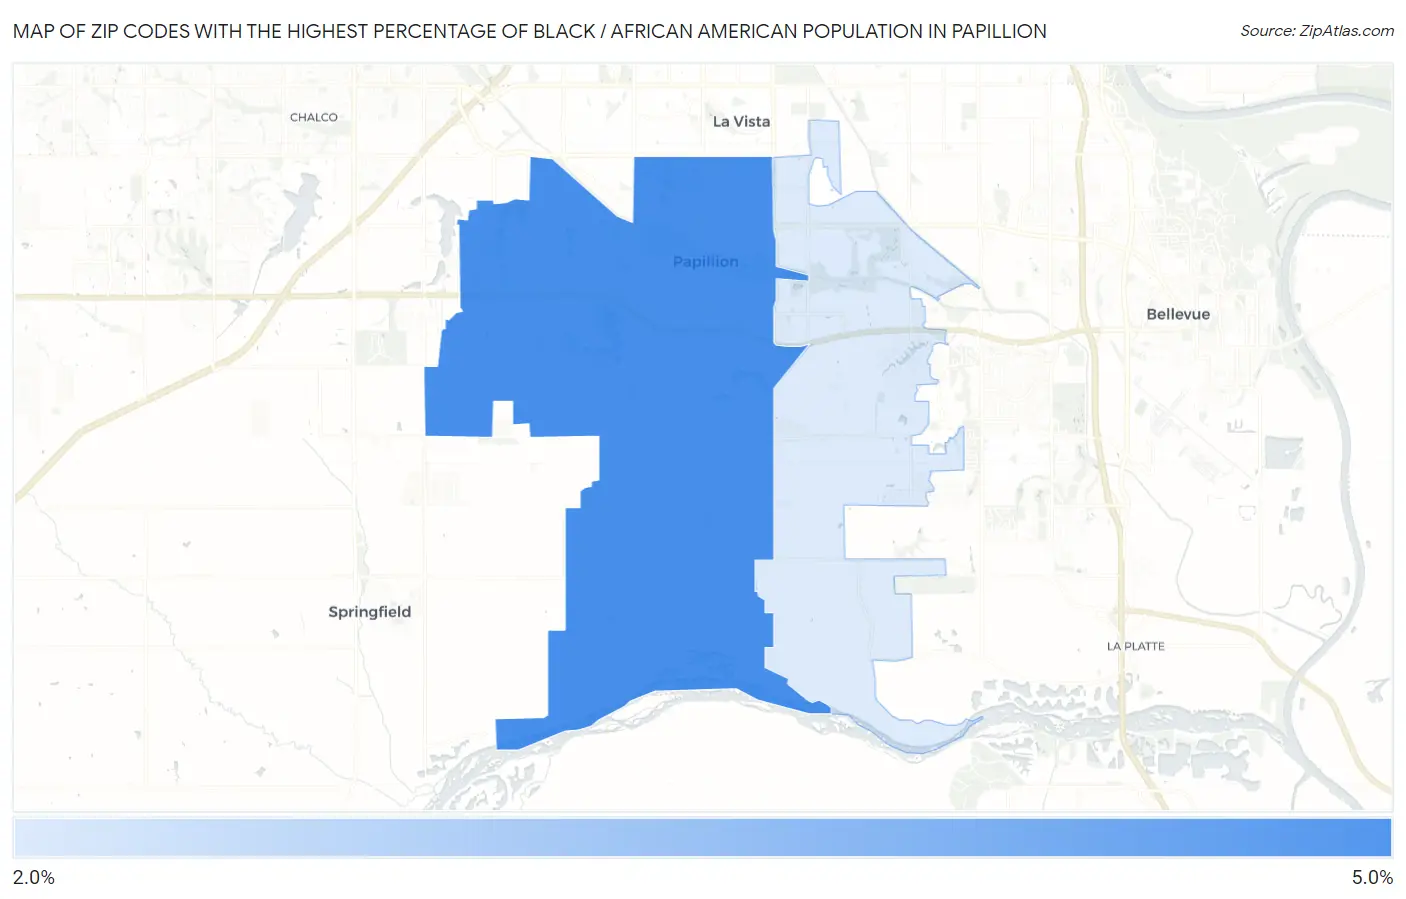
Map of Zip Codes with the Highest Percentage of Black / African American Population in Papillion
2.6%
4.6%
Zip Codes with the Highest Percentage of Black / African American Population in Papillion, NE
| Zip Code | Black / African American | vs State | vs National | |
| 1. | 68046 | 4.6% | 4.8%(-0.201)#37 | 12.5%(-7.90)#9,942 |
| 2. | 68133 | 2.6% | 4.8%(-2.22)#64 | 12.5%(-9.92)#12,520 |
1
Common Questions
What are the Top Zip Codes with the Highest Percentage of Black / African American Population in Papillion, NE?
Top Zip Codes with the Highest Percentage of Black / African American Population in Papillion, NE are:
What zip code has the Highest Percentage of Black / African American Population in Papillion, NE?
68046 has the Highest Percentage of Black / African American Population in Papillion, NE with 4.6%.
What is the Percentage of Black / African American Population in Papillion, NE?
Percentage of Black / African American Population in Papillion is 2.5%.
What is the Percentage of Black / African American Population in Nebraska?
Percentage of Black / African American Population in Nebraska is 4.8%.
What is the Percentage of Black / African American Population in the United States?
Percentage of Black / African American Population in the United States is 12.5%.