Zip Codes with the Highest Unemployment Rate in Omaha, NE

RELATED REPORTS & OPTIONS

Highest Unemployment
Population
Families and Households
Female Fertility
Female Fertility (Unmarried)
Race (Community Size)
Race (Percentage)
Ancestry (Community Size)
AfghanAfricanAlbanianAleutAmericanApacheArabArapahoArgentineanArmenianAustralianAustrianBangladeshiBasqueBelgianBhutaneseBlackfeetBolivianBrazilianBritishBulgarianBurmeseCajunCambodianCanadianCarpatho RusynCentral AmericanCentral American IndianCherokeeChickasawChileanChineseChippewaChoctawColombianComancheCosta RicanCreekCroatianCubanCzechCzechoslovakianDanishDominicanDutchEastern EuropeanEcuadorianEgyptianEnglishEthiopianEuropeanFilipinoFinnishFrenchFrench American IndianFrench CanadianGermanGerman RussianGhanaianGreekGuamanian / ChamorroGuatemalanGuyaneseHaitianHonduranHungarianIcelanderIndian (Asian)IndonesianInupiatIranianIraqiIrishIroquoisIsraeliItalianJamaicanJapaneseJordanianKenyanKiowaKoreanLaotianLatvianLebaneseLithuanianLuxembourgerMacedonianMalaysianMexicanMexican American IndianMoroccanNative HawaiianNavajoNicaraguanNigerianNorthern EuropeanNorwegianPakistaniPalestinianPanamanianPennsylvania GermanPeruvianPolishPortuguesePotawatomiPuebloPuerto RicanRomanianRussianSalvadoranSamoanScandinavianScotch-IrishScottishSeminoleSerbianSiouxSlavicSlovakSloveneSomaliSouth AfricanSouth AmericanSpaniardSpanishSri LankanSubsaharan AfricanSudaneseSwedishSwissSyrianThaiTlingit-HaidaTrinidadian and TobagonianTurkishUkrainianVenezuelanVietnameseWelshWest IndianYugoslavianZimbabwean
Ancestry (Percentage)
AfghanAfricanAlbanianAleutAmericanApacheArabArapahoArgentineanArmenianAustralianAustrianBangladeshiBasqueBelgianBhutaneseBlackfeetBolivianBrazilianBritishBulgarianBurmeseCajunCambodianCanadianCarpatho RusynCentral AmericanCentral American IndianCherokeeChickasawChileanChineseChippewaChoctawColombianComancheCosta RicanCreekCroatianCubanCzechCzechoslovakianDanishDominicanDutchEastern EuropeanEcuadorianEgyptianEnglishEthiopianEuropeanFilipinoFinnishFrenchFrench American IndianFrench CanadianGermanGerman RussianGhanaianGreekGuamanian / ChamorroGuatemalanGuyaneseHaitianHonduranHungarianIcelanderIndian (Asian)IndonesianInupiatIranianIraqiIrishIroquoisIsraeliItalianJamaicanJapaneseJordanianKenyanKiowaKoreanLaotianLatvianLebaneseLithuanianLuxembourgerMacedonianMalaysianMexicanMexican American IndianMoroccanNative HawaiianNavajoNicaraguanNigerianNorthern EuropeanNorwegianPakistaniPalestinianPanamanianPennsylvania GermanPeruvianPolishPortuguesePotawatomiPuebloPuerto RicanRomanianRussianSalvadoranSamoanScandinavianScotch-IrishScottishSeminoleSerbianSiouxSlavicSlovakSloveneSomaliSouth AfricanSouth AmericanSpaniardSpanishSri LankanSubsaharan AfricanSudaneseSwedishSwissSyrianThaiTlingit-HaidaTrinidadian and TobagonianTurkishUkrainianVenezuelanVietnameseWelshWest IndianYugoslavianZimbabwean
Immigrant Origin (Total)
AfghanistanAfricaArgentinaAsiaAustraliaBangladeshBarbadosBelarusBosnia and HerzegovinaBrazilBurma / MyanmarCameroonCanadaCaribbeanCentral AmericaChileChinaColombiaCongoCosta RicaCroatiaCubaCzechoslovakiaDominican RepublicEastern AfricaEastern AsiaEastern EuropeEgyptEl SalvadorEnglandEthiopiaEuropeFranceGermanyGhanaGreeceGuatemalaHondurasHong KongHungaryIndiaIndonesiaIranIraqIrelandIsraelItalyJamaicaJapanJordanKazakhstanKenyaKoreaKuwaitLaosLatin AmericaLatviaLithuaniaMalaysiaMexicoMiddle AfricaMoroccoNepalNetherlandsNicaraguaNigeriaNorthern AfricaNorthern EuropeOceaniaPakistanPanamaPeruPhilippinesPolandPortugalRomaniaRussiaSaudi ArabiaScotlandSierra LeoneSomaliaSouth AfricaSouth AmericaSouth Central AsiaSouth Eastern AsiaSouthern EuropeSpainSri LankaSudanSyriaTaiwanThailandTrinidad and TobagoTurkeyUgandaUkraineVenezuelaVietnamWestern AfricaWestern AsiaWestern EuropeZaireZimbabwe
Immigrant Origin (Percentage)
AfghanistanAfricaArgentinaAsiaAustraliaBangladeshBarbadosBelarusBosnia and HerzegovinaBrazilBurma / MyanmarCameroonCanadaCaribbeanCentral AmericaChileChinaColombiaCongoCosta RicaCroatiaCubaCzechoslovakiaDominican RepublicEastern AfricaEastern AsiaEastern EuropeEgyptEl SalvadorEnglandEthiopiaEuropeFranceGermanyGhanaGreeceGuatemalaHondurasHong KongHungaryIndiaIndonesiaIranIraqIrelandIsraelItalyJamaicaJapanJordanKazakhstanKenyaKoreaKuwaitLaosLatin AmericaLatviaLithuaniaMalaysiaMexicoMiddle AfricaMoroccoNepalNetherlandsNicaraguaNigeriaNorthern AfricaNorthern EuropeOceaniaPakistanPanamaPeruPhilippinesPolandPortugalRomaniaRussiaSaudi ArabiaScotlandSierra LeoneSomaliaSouth AfricaSouth AmericaSouth Central AsiaSouth Eastern AsiaSouthern EuropeSpainSri LankaSudanSyriaTaiwanThailandTrinidad and TobagoTurkeyUgandaUkraineVenezuelaVietnamWestern AfricaWestern AsiaWestern EuropeZaireZimbabwe
Income
Income (Families)
Income (Households)
Poverty
Poverty (Families)
Unemployment
Employment Occupations
Employment Industries
Employer Class
Commute Time
Commute Means
School Enrollment
Education by Degree Field
Occupancy
Finances
Physical Characteristics
Omaha
Compare Zip Codes
Comparison Subject

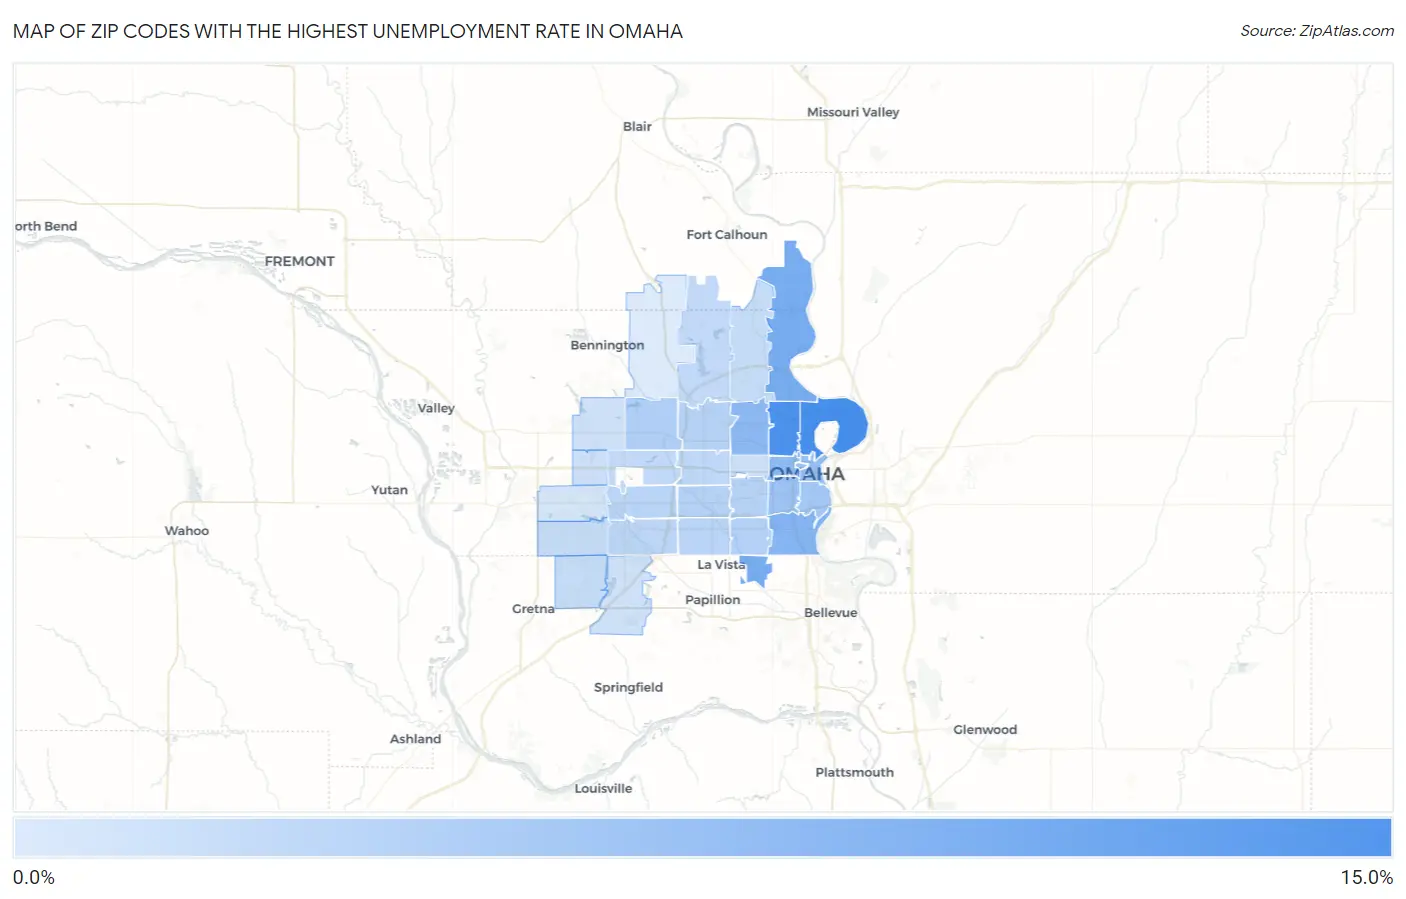
Map of Zip Codes with the Highest Unemployment Rate in Omaha

0.0%
15.0%
Zip Codes with the Highest Unemployment Rate in Omaha Map

Zip Codes with the Highest Unemployment Rate in Omaha, NE

Zip Code Unemployment Rate vs State vs National
1.6811010.8%2.7%(+8.10)#175.0%(+5.80)#2,771
2.6811110.4%2.7%(+7.70)#195.0%(+5.40)#2,992
3.681127.2%2.7%(+4.50)#345.0%(+2.20)#6,263
4.681577.2%2.7%(+4.50)#355.0%(+2.20)#6,278
5.681076.3%2.7%(+3.60)#455.0%(+1.30)#7,934
6.681045.7%2.7%(+3.00)#525.0%(+0.700)#9,385
7.681315.5%2.7%(+2.80)#595.0%(+0.500)#10,083
8.681025.0%2.7%(+2.30)#675.0%(=0.000)#11,635
9.681784.8%2.7%(+2.10)#715.0%(-0.200)#12,387
10.681054.7%2.7%(+2.00)#735.0%(-0.300)#12,602
11.681084.2%2.7%(+1.50)#845.0%(-0.800)#14,501
12.681643.2%2.7%(+0.500)#1225.0%(-1.80)#18,534
13.681173.0%2.7%(+0.300)#1355.0%(-2.00)#19,471
14.681062.9%2.7%(+0.200)#1405.0%(-2.10)#19,773
15.681242.9%2.7%(+0.200)#1415.0%(-2.10)#19,818
16.681342.8%2.7%(+0.100)#1495.0%(-2.20)#20,148
17.681272.6%2.7%(-0.100)#1625.0%(-2.40)#20,925
18.681442.5%2.7%(-0.200)#1705.0%(-2.50)#21,278
19.681372.4%2.7%(-0.300)#1845.0%(-2.60)#21,689
20.681142.3%2.7%(-0.400)#1995.0%(-2.70)#22,096
21.681222.1%2.7%(-0.600)#2175.0%(-2.90)#22,813
22.681542.0%2.7%(-0.700)#2255.0%(-3.00)#23,109
23.681351.8%2.7%(-0.900)#2485.0%(-3.20)#23,738
24.681361.7%2.7%(-1.00)#2575.0%(-3.30)#24,057
25.681521.7%2.7%(-1.00)#2595.0%(-3.30)#24,126
26.681321.3%2.7%(-1.40)#2875.0%(-3.70)#25,097
27.681181.3%2.7%(-1.40)#2895.0%(-3.70)#25,119
28.681161.2%2.7%(-1.50)#2985.0%(-3.80)#25,345
29.681381.1%2.7%(-1.60)#3135.0%(-3.90)#25,617
30.681300.70%2.7%(-2.00)#3525.0%(-4.30)#26,493
31.681420.20%2.7%(-2.50)#4085.0%(-4.80)#27,270

Common Questions

What are the Top 10 Zip Codes with the Highest Unemployment Rate in Omaha, NE?
Top 10 Zip Codes with the Highest Unemployment Rate in Omaha, NE are:
#1
10.8%
#2
10.4%
#3
7.2%
#4
7.2%
#5
6.3%
#6
5.7%
#7
5.5%
#8
5.0%
#9
4.8%
#10
4.7%
What zip code has the Highest Unemployment Rate in Omaha, NE?
68110 has the Highest Unemployment Rate in Omaha, NE with 10.8%.
What is the Unemployment Rate in Omaha, NE?
Unemployment Rate in Omaha is 3.6%.
What is the Unemployment Rate in Nebraska?
Unemployment Rate in Nebraska is 2.7%.
What is the Unemployment Rate in the United States?
Unemployment Rate in the United States is 5.0%.