Zip Codes with the Highest Poverty Level in Omaha, NE

RELATED REPORTS & OPTIONS

Highest Poverty
Population
Families and Households
Female Fertility
Female Fertility (Unmarried)
Race (Community Size)
Race (Percentage)
Ancestry (Community Size)
AfghanAfricanAlbanianAleutAmericanApacheArabArapahoArgentineanArmenianAustralianAustrianBangladeshiBasqueBelgianBhutaneseBlackfeetBolivianBrazilianBritishBulgarianBurmeseCajunCambodianCanadianCarpatho RusynCentral AmericanCentral American IndianCherokeeChickasawChileanChineseChippewaChoctawColombianComancheCosta RicanCreekCroatianCubanCzechCzechoslovakianDanishDominicanDutchEastern EuropeanEcuadorianEgyptianEnglishEthiopianEuropeanFilipinoFinnishFrenchFrench American IndianFrench CanadianGermanGerman RussianGhanaianGreekGuamanian / ChamorroGuatemalanGuyaneseHaitianHonduranHungarianIcelanderIndian (Asian)IndonesianInupiatIranianIraqiIrishIroquoisIsraeliItalianJamaicanJapaneseJordanianKenyanKiowaKoreanLaotianLatvianLebaneseLithuanianLuxembourgerMacedonianMalaysianMexicanMexican American IndianMoroccanNative HawaiianNavajoNicaraguanNigerianNorthern EuropeanNorwegianPakistaniPalestinianPanamanianPennsylvania GermanPeruvianPolishPortuguesePotawatomiPuebloPuerto RicanRomanianRussianSalvadoranSamoanScandinavianScotch-IrishScottishSeminoleSerbianSiouxSlavicSlovakSloveneSomaliSouth AfricanSouth AmericanSpaniardSpanishSri LankanSubsaharan AfricanSudaneseSwedishSwissSyrianThaiTlingit-HaidaTrinidadian and TobagonianTurkishUkrainianVenezuelanVietnameseWelshWest IndianYugoslavianZimbabwean
Ancestry (Percentage)
AfghanAfricanAlbanianAleutAmericanApacheArabArapahoArgentineanArmenianAustralianAustrianBangladeshiBasqueBelgianBhutaneseBlackfeetBolivianBrazilianBritishBulgarianBurmeseCajunCambodianCanadianCarpatho RusynCentral AmericanCentral American IndianCherokeeChickasawChileanChineseChippewaChoctawColombianComancheCosta RicanCreekCroatianCubanCzechCzechoslovakianDanishDominicanDutchEastern EuropeanEcuadorianEgyptianEnglishEthiopianEuropeanFilipinoFinnishFrenchFrench American IndianFrench CanadianGermanGerman RussianGhanaianGreekGuamanian / ChamorroGuatemalanGuyaneseHaitianHonduranHungarianIcelanderIndian (Asian)IndonesianInupiatIranianIraqiIrishIroquoisIsraeliItalianJamaicanJapaneseJordanianKenyanKiowaKoreanLaotianLatvianLebaneseLithuanianLuxembourgerMacedonianMalaysianMexicanMexican American IndianMoroccanNative HawaiianNavajoNicaraguanNigerianNorthern EuropeanNorwegianPakistaniPalestinianPanamanianPennsylvania GermanPeruvianPolishPortuguesePotawatomiPuebloPuerto RicanRomanianRussianSalvadoranSamoanScandinavianScotch-IrishScottishSeminoleSerbianSiouxSlavicSlovakSloveneSomaliSouth AfricanSouth AmericanSpaniardSpanishSri LankanSubsaharan AfricanSudaneseSwedishSwissSyrianThaiTlingit-HaidaTrinidadian and TobagonianTurkishUkrainianVenezuelanVietnameseWelshWest IndianYugoslavianZimbabwean
Immigrant Origin (Total)
AfghanistanAfricaArgentinaAsiaAustraliaBangladeshBarbadosBelarusBosnia and HerzegovinaBrazilBurma / MyanmarCameroonCanadaCaribbeanCentral AmericaChileChinaColombiaCongoCosta RicaCroatiaCubaCzechoslovakiaDominican RepublicEastern AfricaEastern AsiaEastern EuropeEgyptEl SalvadorEnglandEthiopiaEuropeFranceGermanyGhanaGreeceGuatemalaHondurasHong KongHungaryIndiaIndonesiaIranIraqIrelandIsraelItalyJamaicaJapanJordanKazakhstanKenyaKoreaKuwaitLaosLatin AmericaLatviaLithuaniaMalaysiaMexicoMiddle AfricaMoroccoNepalNetherlandsNicaraguaNigeriaNorthern AfricaNorthern EuropeOceaniaPakistanPanamaPeruPhilippinesPolandPortugalRomaniaRussiaSaudi ArabiaScotlandSierra LeoneSomaliaSouth AfricaSouth AmericaSouth Central AsiaSouth Eastern AsiaSouthern EuropeSpainSri LankaSudanSyriaTaiwanThailandTrinidad and TobagoTurkeyUgandaUkraineVenezuelaVietnamWestern AfricaWestern AsiaWestern EuropeZaireZimbabwe
Immigrant Origin (Percentage)
AfghanistanAfricaArgentinaAsiaAustraliaBangladeshBarbadosBelarusBosnia and HerzegovinaBrazilBurma / MyanmarCameroonCanadaCaribbeanCentral AmericaChileChinaColombiaCongoCosta RicaCroatiaCubaCzechoslovakiaDominican RepublicEastern AfricaEastern AsiaEastern EuropeEgyptEl SalvadorEnglandEthiopiaEuropeFranceGermanyGhanaGreeceGuatemalaHondurasHong KongHungaryIndiaIndonesiaIranIraqIrelandIsraelItalyJamaicaJapanJordanKazakhstanKenyaKoreaKuwaitLaosLatin AmericaLatviaLithuaniaMalaysiaMexicoMiddle AfricaMoroccoNepalNetherlandsNicaraguaNigeriaNorthern AfricaNorthern EuropeOceaniaPakistanPanamaPeruPhilippinesPolandPortugalRomaniaRussiaSaudi ArabiaScotlandSierra LeoneSomaliaSouth AfricaSouth AmericaSouth Central AsiaSouth Eastern AsiaSouthern EuropeSpainSri LankaSudanSyriaTaiwanThailandTrinidad and TobagoTurkeyUgandaUkraineVenezuelaVietnamWestern AfricaWestern AsiaWestern EuropeZaireZimbabwe
Income
Income (Families)
Income (Households)
Poverty
Poverty (Families)
Unemployment
Employment Occupations
Employment Industries
Employer Class
Commute Time
Commute Means
School Enrollment
Education by Degree Field
Occupancy
Finances
Physical Characteristics
Omaha
Compare Zip Codes
Comparison Subject

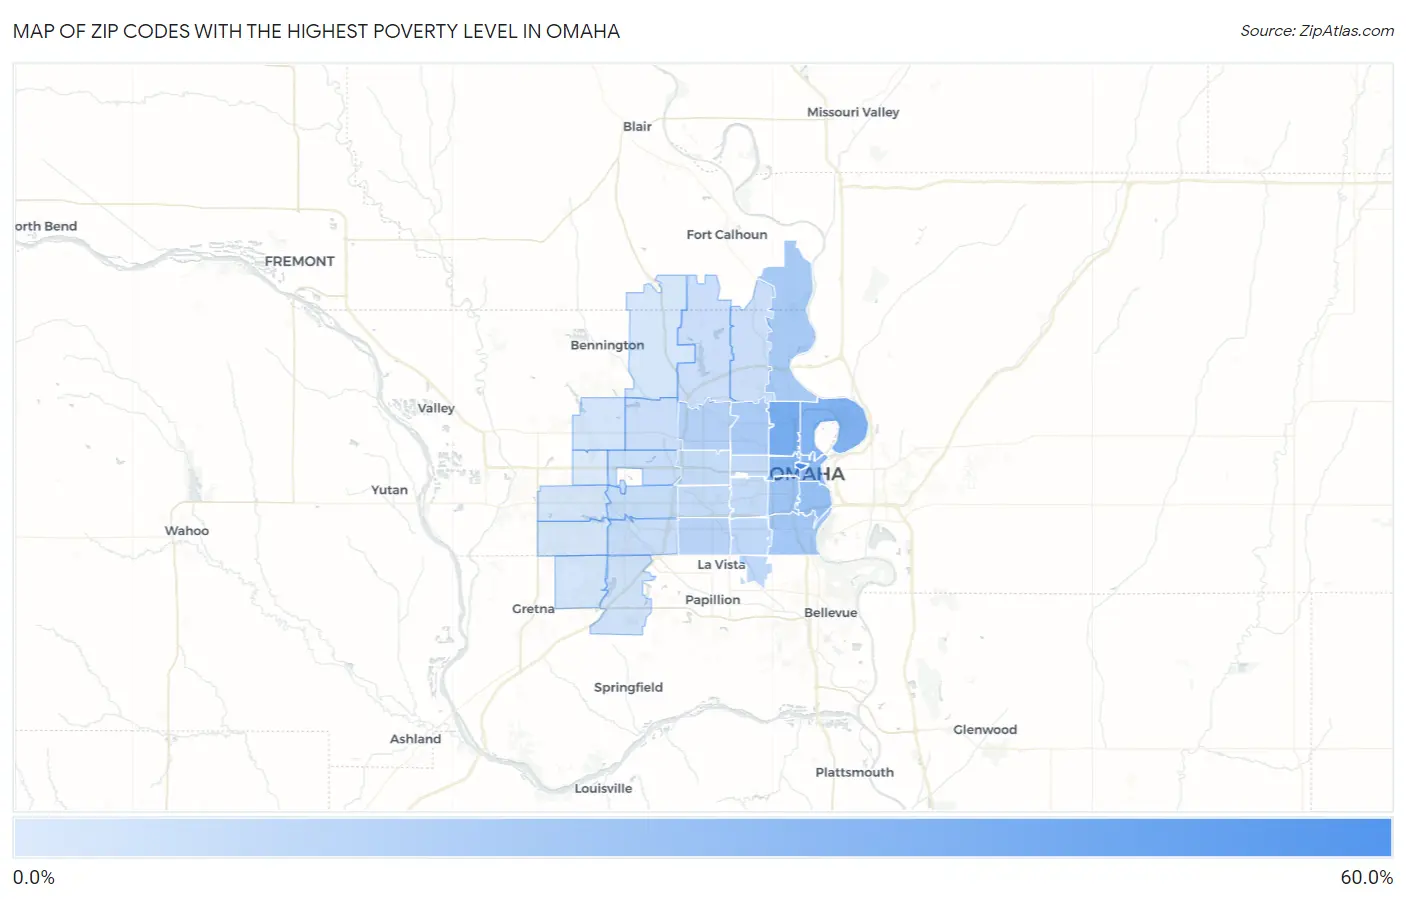
Map of Zip Codes with the Highest Poverty Level in Omaha

0.0%
60.0%
Zip Codes with the Highest Poverty Level in Omaha Map

Zip Codes with the Highest Poverty Level in Omaha, NE

Zip Code Poverty vs State vs National
1.6817853.5%10.4%(+43.1)#512.5%(+40.9)#473
2.6811134.3%10.4%(+23.9)#1012.5%(+21.7)#1,637
3.6811030.9%10.4%(+20.5)#1112.5%(+18.4)#2,199
4.6813128.1%10.4%(+17.7)#1312.5%(+15.6)#2,766
5.6810225.8%10.4%(+15.4)#1712.5%(+13.3)#3,357
6.6810823.5%10.4%(+13.1)#2112.5%(+11.0)#4,216
7.6810519.6%10.4%(+9.24)#4112.5%(+7.10)#6,328
8.6810718.6%10.4%(+8.17)#4712.5%(+6.04)#7,093
9.6811216.6%10.4%(+6.25)#6212.5%(+4.11)#8,718
10.6810416.0%10.4%(+5.63)#6812.5%(+3.49)#9,337
11.6813413.2%10.4%(+2.82)#12112.5%(+0.683)#12,566
12.6812711.8%10.4%(+1.37)#15212.5%(-0.762)#14,606
13.681579.7%10.4%(-0.704)#22912.5%(-2.84)#17,957
14.681179.7%10.4%(-0.734)#23212.5%(-2.87)#18,015
15.681328.5%10.4%(-1.94)#27512.5%(-4.08)#20,148
16.681248.2%10.4%(-2.24)#28412.5%(-4.38)#20,705
17.681148.1%10.4%(-2.27)#28612.5%(-4.41)#20,752
18.681068.1%10.4%(-2.28)#28712.5%(-4.41)#20,761
19.681447.4%10.4%(-3.05)#31612.5%(-5.18)#22,177
20.681376.6%10.4%(-3.83)#34612.5%(-5.97)#23,635
21.681546.5%10.4%(-3.93)#35612.5%(-6.07)#23,812
22.681646.3%10.4%(-4.07)#36012.5%(-6.20)#24,056
23.681225.8%10.4%(-4.57)#37712.5%(-6.71)#24,948
24.681525.8%10.4%(-4.57)#37812.5%(-6.71)#24,952
25.681385.0%10.4%(-5.45)#41412.5%(-7.58)#26,448
26.681163.6%10.4%(-6.79)#46012.5%(-8.92)#28,524
27.681363.1%10.4%(-7.30)#48812.5%(-9.43)#29,252
28.681423.0%10.4%(-7.43)#49512.5%(-9.56)#29,424
29.681302.6%10.4%(-7.83)#51012.5%(-9.96)#29,859
30.681352.4%10.4%(-7.99)#51612.5%(-10.1)#30,035
31.681180.73%10.4%(-9.67)#55112.5%(-11.8)#31,045

Common Questions

What are the Top 10 Zip Codes with the Highest Poverty Level in Omaha, NE?
Top 10 Zip Codes with the Highest Poverty Level in Omaha, NE are:
#1
53.5%
#2
34.3%
#3
30.9%
#4
28.1%
#5
25.8%
#6
23.5%
#7
19.6%
#8
18.6%
#9
16.6%
#10
16.0%
What zip code has the Highest Poverty Level in Omaha, NE?
68178 has the Highest Poverty Level in Omaha, NE with 53.5%.
What is the Poverty Level in Omaha, NE?
Poverty Level in Omaha is 12.5%.
What is the Poverty Level in Nebraska?
Poverty Level in Nebraska is 10.4%.
What is the Poverty Level in the United States?
Poverty Level in the United States is 12.5%.