Zip Codes with the Highest Percentage of Self-Employed / Incorporated in Omaha, NE

RELATED REPORTS & OPTIONS

Self-Employed / Incorporated
Population
Families and Households
Female Fertility
Female Fertility (Unmarried)
Race (Community Size)
Race (Percentage)
Ancestry (Community Size)
AfghanAfricanAlbanianAleutAmericanApacheArabArapahoArgentineanArmenianAustralianAustrianBangladeshiBasqueBelgianBhutaneseBlackfeetBolivianBrazilianBritishBulgarianBurmeseCajunCambodianCanadianCarpatho RusynCentral AmericanCentral American IndianCherokeeChickasawChileanChineseChippewaChoctawColombianComancheCosta RicanCreekCroatianCubanCzechCzechoslovakianDanishDominicanDutchEastern EuropeanEcuadorianEgyptianEnglishEthiopianEuropeanFilipinoFinnishFrenchFrench American IndianFrench CanadianGermanGerman RussianGhanaianGreekGuamanian / ChamorroGuatemalanGuyaneseHaitianHonduranHungarianIcelanderIndian (Asian)IndonesianInupiatIranianIraqiIrishIroquoisIsraeliItalianJamaicanJapaneseJordanianKenyanKiowaKoreanLaotianLatvianLebaneseLithuanianLuxembourgerMacedonianMalaysianMexicanMexican American IndianMoroccanNative HawaiianNavajoNicaraguanNigerianNorthern EuropeanNorwegianPakistaniPalestinianPanamanianPennsylvania GermanPeruvianPolishPortuguesePotawatomiPuebloPuerto RicanRomanianRussianSalvadoranSamoanScandinavianScotch-IrishScottishSeminoleSerbianSiouxSlavicSlovakSloveneSomaliSouth AfricanSouth AmericanSpaniardSpanishSri LankanSubsaharan AfricanSudaneseSwedishSwissSyrianThaiTlingit-HaidaTrinidadian and TobagonianTurkishUkrainianVenezuelanVietnameseWelshWest IndianYugoslavianZimbabwean
Ancestry (Percentage)
AfghanAfricanAlbanianAleutAmericanApacheArabArapahoArgentineanArmenianAustralianAustrianBangladeshiBasqueBelgianBhutaneseBlackfeetBolivianBrazilianBritishBulgarianBurmeseCajunCambodianCanadianCarpatho RusynCentral AmericanCentral American IndianCherokeeChickasawChileanChineseChippewaChoctawColombianComancheCosta RicanCreekCroatianCubanCzechCzechoslovakianDanishDominicanDutchEastern EuropeanEcuadorianEgyptianEnglishEthiopianEuropeanFilipinoFinnishFrenchFrench American IndianFrench CanadianGermanGerman RussianGhanaianGreekGuamanian / ChamorroGuatemalanGuyaneseHaitianHonduranHungarianIcelanderIndian (Asian)IndonesianInupiatIranianIraqiIrishIroquoisIsraeliItalianJamaicanJapaneseJordanianKenyanKiowaKoreanLaotianLatvianLebaneseLithuanianLuxembourgerMacedonianMalaysianMexicanMexican American IndianMoroccanNative HawaiianNavajoNicaraguanNigerianNorthern EuropeanNorwegianPakistaniPalestinianPanamanianPennsylvania GermanPeruvianPolishPortuguesePotawatomiPuebloPuerto RicanRomanianRussianSalvadoranSamoanScandinavianScotch-IrishScottishSeminoleSerbianSiouxSlavicSlovakSloveneSomaliSouth AfricanSouth AmericanSpaniardSpanishSri LankanSubsaharan AfricanSudaneseSwedishSwissSyrianThaiTlingit-HaidaTrinidadian and TobagonianTurkishUkrainianVenezuelanVietnameseWelshWest IndianYugoslavianZimbabwean
Immigrant Origin (Total)
AfghanistanAfricaArgentinaAsiaAustraliaBangladeshBarbadosBelarusBosnia and HerzegovinaBrazilBurma / MyanmarCameroonCanadaCaribbeanCentral AmericaChileChinaColombiaCongoCosta RicaCroatiaCubaCzechoslovakiaDominican RepublicEastern AfricaEastern AsiaEastern EuropeEgyptEl SalvadorEnglandEthiopiaEuropeFranceGermanyGhanaGreeceGuatemalaHondurasHong KongHungaryIndiaIndonesiaIranIraqIrelandIsraelItalyJamaicaJapanJordanKazakhstanKenyaKoreaKuwaitLaosLatin AmericaLatviaLithuaniaMalaysiaMexicoMiddle AfricaMoroccoNepalNetherlandsNicaraguaNigeriaNorthern AfricaNorthern EuropeOceaniaPakistanPanamaPeruPhilippinesPolandPortugalRomaniaRussiaSaudi ArabiaScotlandSierra LeoneSomaliaSouth AfricaSouth AmericaSouth Central AsiaSouth Eastern AsiaSouthern EuropeSpainSri LankaSudanSyriaTaiwanThailandTrinidad and TobagoTurkeyUgandaUkraineVenezuelaVietnamWestern AfricaWestern AsiaWestern EuropeZaireZimbabwe
Immigrant Origin (Percentage)
AfghanistanAfricaArgentinaAsiaAustraliaBangladeshBarbadosBelarusBosnia and HerzegovinaBrazilBurma / MyanmarCameroonCanadaCaribbeanCentral AmericaChileChinaColombiaCongoCosta RicaCroatiaCubaCzechoslovakiaDominican RepublicEastern AfricaEastern AsiaEastern EuropeEgyptEl SalvadorEnglandEthiopiaEuropeFranceGermanyGhanaGreeceGuatemalaHondurasHong KongHungaryIndiaIndonesiaIranIraqIrelandIsraelItalyJamaicaJapanJordanKazakhstanKenyaKoreaKuwaitLaosLatin AmericaLatviaLithuaniaMalaysiaMexicoMiddle AfricaMoroccoNepalNetherlandsNicaraguaNigeriaNorthern AfricaNorthern EuropeOceaniaPakistanPanamaPeruPhilippinesPolandPortugalRomaniaRussiaSaudi ArabiaScotlandSierra LeoneSomaliaSouth AfricaSouth AmericaSouth Central AsiaSouth Eastern AsiaSouthern EuropeSpainSri LankaSudanSyriaTaiwanThailandTrinidad and TobagoTurkeyUgandaUkraineVenezuelaVietnamWestern AfricaWestern AsiaWestern EuropeZaireZimbabwe
Income
Income (Families)
Income (Households)
Poverty
Poverty (Families)
Unemployment
Employment Occupations
Employment Industries
Employer Class
Commute Time
Commute Means
School Enrollment
Education by Degree Field
Occupancy
Finances
Physical Characteristics
Omaha
Compare Zip Codes
Comparison Subject

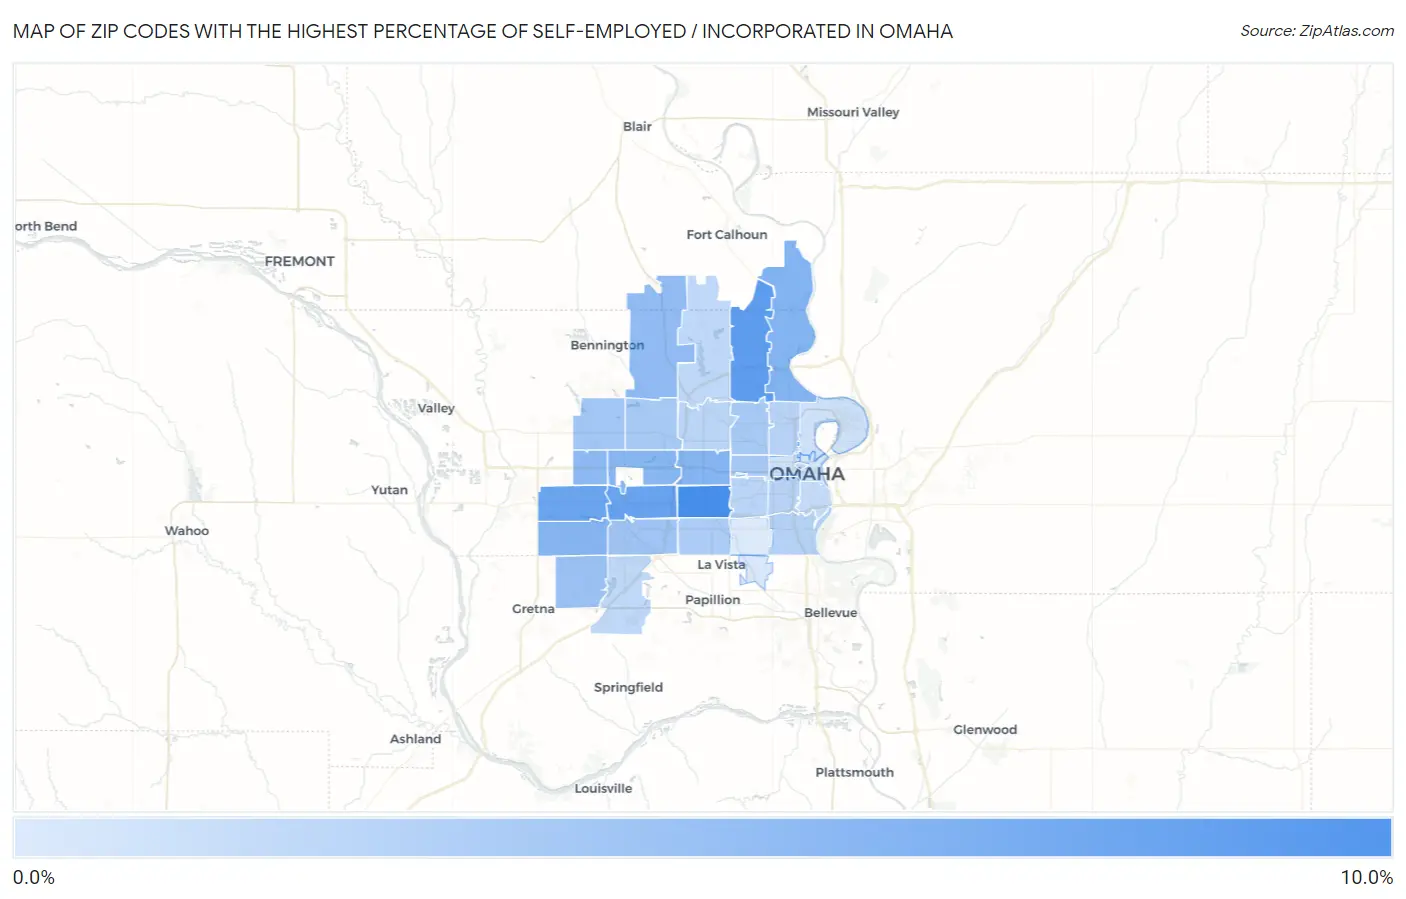
Map of Zip Codes with the Highest Percentage of Self-Employed / Incorporated in Omaha

0.0%
10.0%
Zip Codes with the Highest Percentage of Self-Employed / Incorporated in Omaha Map

Zip Codes with the Highest Percentage of Self-Employed / Incorporated in Omaha, NE

Zip Code % Self-Employed / Incorporated vs State vs National
1.681248.3%4.2%(+4.16)#1263.8%(+4.53)#3,359
2.681527.1%4.2%(+2.88)#1723.8%(+3.24)#4,692
3.681446.6%4.2%(+2.38)#1903.8%(+2.74)#5,414
4.681306.4%4.2%(+2.19)#1963.8%(+2.56)#5,663
5.681125.0%4.2%(+0.858)#2703.8%(+1.22)#8,488
6.681145.0%4.2%(+0.805)#2743.8%(+1.17)#8,645
7.681354.9%4.2%(+0.719)#2753.8%(+1.08)#8,872
8.681544.9%4.2%(+0.678)#2783.8%(+1.04)#9,000
9.681184.4%4.2%(+0.260)#2993.8%(+0.625)#10,293
10.681424.4%4.2%(+0.218)#3013.8%(+0.584)#10,438
11.681363.8%4.2%(-0.423)#3383.8%(-0.058)#12,929
12.681373.6%4.2%(-0.622)#3523.8%(-0.257)#13,761
13.681163.3%4.2%(-0.835)#3673.8%(-0.470)#14,740
14.681323.2%4.2%(-0.965)#3723.8%(-0.600)#15,324
15.681643.1%4.2%(-1.04)#3793.8%(-0.679)#15,708
16.681043.1%4.2%(-1.09)#3813.8%(-0.725)#15,927
17.681272.9%4.2%(-1.25)#3873.8%(-0.880)#16,708
18.681072.5%4.2%(-1.71)#4113.8%(-1.35)#19,057
19.681052.3%4.2%(-1.88)#4183.8%(-1.52)#19,875
20.681112.3%4.2%(-1.89)#4203.8%(-1.53)#19,922
21.681342.2%4.2%(-2.03)#4273.8%(-1.66)#20,604
22.681062.1%4.2%(-2.05)#4293.8%(-1.69)#20,729
23.681221.9%4.2%(-2.29)#4393.8%(-1.92)#21,853
24.681381.9%4.2%(-2.29)#4413.8%(-1.93)#21,872
25.681081.7%4.2%(-2.43)#4533.8%(-2.07)#22,458
26.681781.7%4.2%(-2.50)#4613.8%(-2.13)#22,737
27.681311.1%4.2%(-3.10)#4893.8%(-2.73)#25,031
28.681101.1%4.2%(-3.10)#4903.8%(-2.74)#25,039
29.681020.87%4.2%(-3.31)#4993.8%(-2.94)#25,623
30.681570.51%4.2%(-3.67)#5093.8%(-3.31)#26,479
31.681170.40%4.2%(-3.78)#5123.8%(-3.42)#26,660

Common Questions

What are the Top 10 Zip Codes with the Highest Percentage of Self-Employed / Incorporated in Omaha, NE?
Top 10 Zip Codes with the Highest Percentage of Self-Employed / Incorporated in Omaha, NE are:
#1
8.3%
#2
7.1%
#3
6.6%
#4
6.4%
#5
5.0%
#6
5.0%
#7
4.9%
#8
4.9%
#9
4.4%
#10
4.4%
What zip code has the Highest Percentage of Self-Employed / Incorporated in Omaha, NE?
68124 has the Highest Percentage of Self-Employed / Incorporated in Omaha, NE with 8.3%.
What is the Percentage of Self-Employed / Incorporated in Omaha, NE?
Percentage of Self-Employed / Incorporated in Omaha is 3.6%.
What is the Percentage of Self-Employed / Incorporated in Nebraska?
Percentage of Self-Employed / Incorporated in Nebraska is 4.2%.
What is the Percentage of Self-Employed / Incorporated in the United States?
Percentage of Self-Employed / Incorporated in the United States is 3.8%.