Zip Codes with the Highest Percentage of Population Employed in Sales & Related in Omaha, NE

RELATED REPORTS & OPTIONS

Sales & Related
Population
Families and Households
Female Fertility
Female Fertility (Unmarried)
Race (Community Size)
Race (Percentage)
Ancestry (Community Size)
AfghanAfricanAlbanianAleutAmericanApacheArabArapahoArgentineanArmenianAustralianAustrianBangladeshiBasqueBelgianBhutaneseBlackfeetBolivianBrazilianBritishBulgarianBurmeseCajunCambodianCanadianCarpatho RusynCentral AmericanCentral American IndianCherokeeChickasawChileanChineseChippewaChoctawColombianComancheCosta RicanCreekCroatianCubanCzechCzechoslovakianDanishDominicanDutchEastern EuropeanEcuadorianEgyptianEnglishEthiopianEuropeanFilipinoFinnishFrenchFrench American IndianFrench CanadianGermanGerman RussianGhanaianGreekGuamanian / ChamorroGuatemalanGuyaneseHaitianHonduranHungarianIcelanderIndian (Asian)IndonesianInupiatIranianIraqiIrishIroquoisIsraeliItalianJamaicanJapaneseJordanianKenyanKiowaKoreanLaotianLatvianLebaneseLithuanianLuxembourgerMacedonianMalaysianMexicanMexican American IndianMoroccanNative HawaiianNavajoNicaraguanNigerianNorthern EuropeanNorwegianPakistaniPalestinianPanamanianPennsylvania GermanPeruvianPolishPortuguesePotawatomiPuebloPuerto RicanRomanianRussianSalvadoranSamoanScandinavianScotch-IrishScottishSeminoleSerbianSiouxSlavicSlovakSloveneSomaliSouth AfricanSouth AmericanSpaniardSpanishSri LankanSubsaharan AfricanSudaneseSwedishSwissSyrianThaiTlingit-HaidaTrinidadian and TobagonianTurkishUkrainianVenezuelanVietnameseWelshWest IndianYugoslavianZimbabwean
Ancestry (Percentage)
AfghanAfricanAlbanianAleutAmericanApacheArabArapahoArgentineanArmenianAustralianAustrianBangladeshiBasqueBelgianBhutaneseBlackfeetBolivianBrazilianBritishBulgarianBurmeseCajunCambodianCanadianCarpatho RusynCentral AmericanCentral American IndianCherokeeChickasawChileanChineseChippewaChoctawColombianComancheCosta RicanCreekCroatianCubanCzechCzechoslovakianDanishDominicanDutchEastern EuropeanEcuadorianEgyptianEnglishEthiopianEuropeanFilipinoFinnishFrenchFrench American IndianFrench CanadianGermanGerman RussianGhanaianGreekGuamanian / ChamorroGuatemalanGuyaneseHaitianHonduranHungarianIcelanderIndian (Asian)IndonesianInupiatIranianIraqiIrishIroquoisIsraeliItalianJamaicanJapaneseJordanianKenyanKiowaKoreanLaotianLatvianLebaneseLithuanianLuxembourgerMacedonianMalaysianMexicanMexican American IndianMoroccanNative HawaiianNavajoNicaraguanNigerianNorthern EuropeanNorwegianPakistaniPalestinianPanamanianPennsylvania GermanPeruvianPolishPortuguesePotawatomiPuebloPuerto RicanRomanianRussianSalvadoranSamoanScandinavianScotch-IrishScottishSeminoleSerbianSiouxSlavicSlovakSloveneSomaliSouth AfricanSouth AmericanSpaniardSpanishSri LankanSubsaharan AfricanSudaneseSwedishSwissSyrianThaiTlingit-HaidaTrinidadian and TobagonianTurkishUkrainianVenezuelanVietnameseWelshWest IndianYugoslavianZimbabwean
Immigrant Origin (Total)
AfghanistanAfricaArgentinaAsiaAustraliaBangladeshBarbadosBelarusBosnia and HerzegovinaBrazilBurma / MyanmarCameroonCanadaCaribbeanCentral AmericaChileChinaColombiaCongoCosta RicaCroatiaCubaCzechoslovakiaDominican RepublicEastern AfricaEastern AsiaEastern EuropeEgyptEl SalvadorEnglandEthiopiaEuropeFranceGermanyGhanaGreeceGuatemalaHondurasHong KongHungaryIndiaIndonesiaIranIraqIrelandIsraelItalyJamaicaJapanJordanKazakhstanKenyaKoreaKuwaitLaosLatin AmericaLatviaLithuaniaMalaysiaMexicoMiddle AfricaMoroccoNepalNetherlandsNicaraguaNigeriaNorthern AfricaNorthern EuropeOceaniaPakistanPanamaPeruPhilippinesPolandPortugalRomaniaRussiaSaudi ArabiaScotlandSierra LeoneSomaliaSouth AfricaSouth AmericaSouth Central AsiaSouth Eastern AsiaSouthern EuropeSpainSri LankaSudanSyriaTaiwanThailandTrinidad and TobagoTurkeyUgandaUkraineVenezuelaVietnamWestern AfricaWestern AsiaWestern EuropeZaireZimbabwe
Immigrant Origin (Percentage)
AfghanistanAfricaArgentinaAsiaAustraliaBangladeshBarbadosBelarusBosnia and HerzegovinaBrazilBurma / MyanmarCameroonCanadaCaribbeanCentral AmericaChileChinaColombiaCongoCosta RicaCroatiaCubaCzechoslovakiaDominican RepublicEastern AfricaEastern AsiaEastern EuropeEgyptEl SalvadorEnglandEthiopiaEuropeFranceGermanyGhanaGreeceGuatemalaHondurasHong KongHungaryIndiaIndonesiaIranIraqIrelandIsraelItalyJamaicaJapanJordanKazakhstanKenyaKoreaKuwaitLaosLatin AmericaLatviaLithuaniaMalaysiaMexicoMiddle AfricaMoroccoNepalNetherlandsNicaraguaNigeriaNorthern AfricaNorthern EuropeOceaniaPakistanPanamaPeruPhilippinesPolandPortugalRomaniaRussiaSaudi ArabiaScotlandSierra LeoneSomaliaSouth AfricaSouth AmericaSouth Central AsiaSouth Eastern AsiaSouthern EuropeSpainSri LankaSudanSyriaTaiwanThailandTrinidad and TobagoTurkeyUgandaUkraineVenezuelaVietnamWestern AfricaWestern AsiaWestern EuropeZaireZimbabwe
Income
Income (Families)
Income (Households)
Poverty
Poverty (Families)
Unemployment
Employment Occupations
Employment Industries
Employer Class
Commute Time
Commute Means
School Enrollment
Education by Degree Field
Occupancy
Finances
Physical Characteristics
Omaha
Compare Zip Codes
Comparison Subject

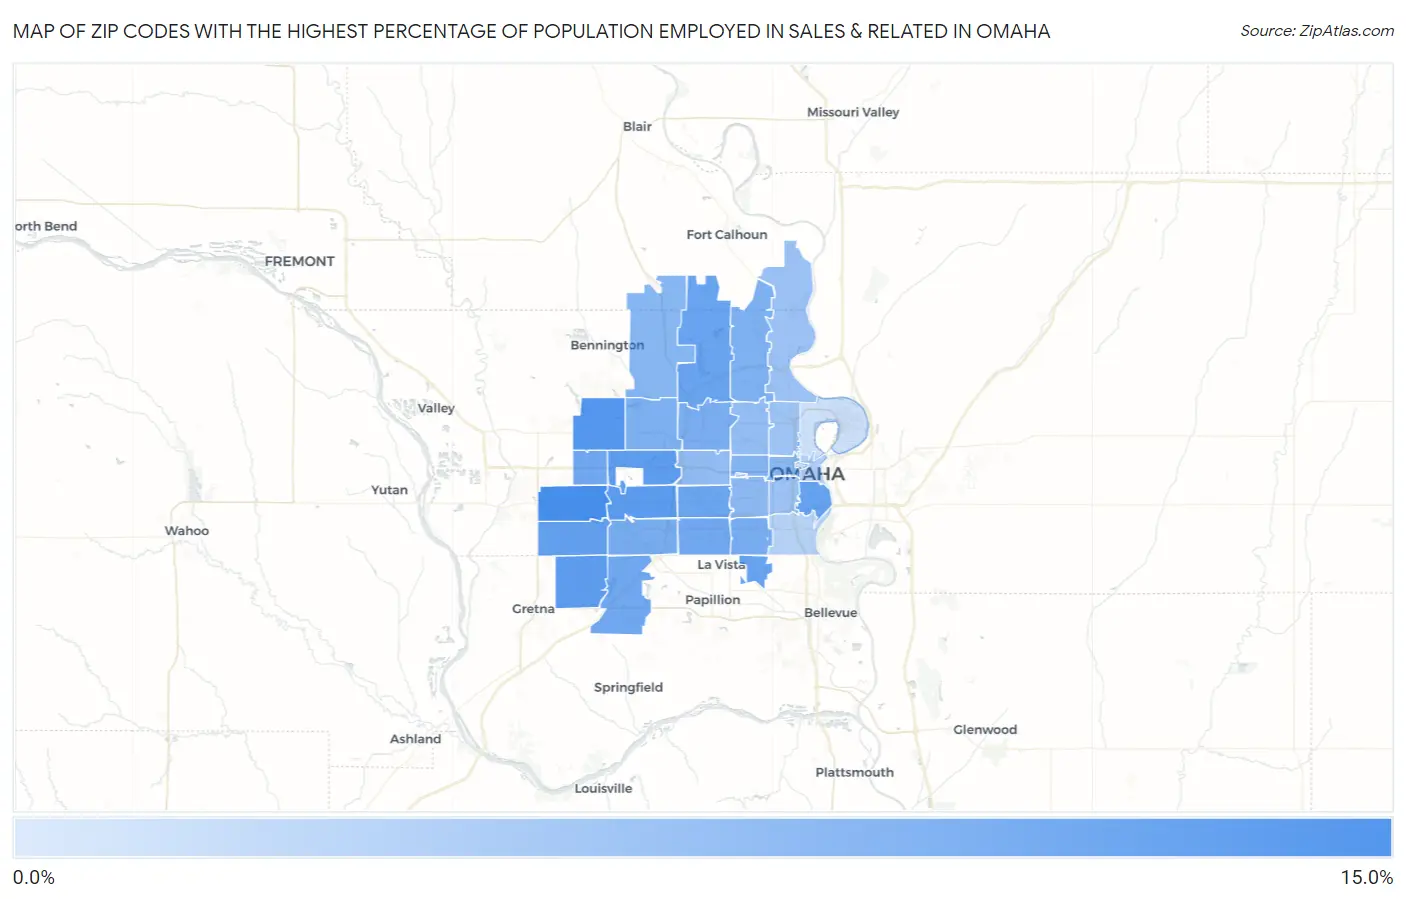
Map of Zip Codes with the Highest Percentage of Population Employed in Sales & Related in Omaha

0.0%
15.0%
Zip Codes with the Highest Percentage of Population Employed in Sales & Related in Omaha Map

Zip Codes with the Highest Percentage of Population Employed in Sales & Related in Omaha, NE

Zip Code % Employed vs State vs National
1.6813013.7%9.0%(+4.69)#489.6%(+4.07)#3,788
2.6811612.5%9.0%(+3.50)#639.6%(+2.88)#5,215
3.6814411.9%9.0%(+2.92)#719.6%(+2.30)#6,234
4.6813611.8%9.0%(+2.86)#729.6%(+2.24)#6,345
5.6815411.8%9.0%(+2.78)#759.6%(+2.16)#6,490
6.6813511.4%9.0%(+2.41)#949.6%(+1.79)#7,282
7.6810811.1%9.0%(+2.18)#1019.6%(+1.55)#7,824
8.6815710.9%9.0%(+1.97)#1079.6%(+1.35)#8,343
9.6812210.8%9.0%(+1.78)#1119.6%(+1.16)#8,836
10.6812410.6%9.0%(+1.58)#1149.6%(+0.961)#9,399
11.6811810.3%9.0%(+1.32)#1239.6%(+0.696)#10,138
12.6813810.2%9.0%(+1.24)#1289.6%(+0.620)#10,374
13.6812710.2%9.0%(+1.22)#1299.6%(+0.603)#10,435
14.681379.7%9.0%(+0.762)#1519.6%(+0.140)#11,906
15.681179.6%9.0%(+0.653)#1559.6%(+0.032)#12,292
16.681349.6%9.0%(+0.618)#1589.6%(-0.003)#12,424
17.681649.3%9.0%(+0.292)#1709.6%(-0.329)#13,540
18.681529.1%9.0%(+0.134)#1799.6%(-0.487)#14,118
19.681328.8%9.0%(-0.184)#1969.6%(-0.805)#15,298
20.681428.3%9.0%(-0.627)#2229.6%(-1.25)#16,883
21.681318.2%9.0%(-0.790)#2299.6%(-1.41)#17,466
22.681068.0%9.0%(-0.952)#2419.6%(-1.57)#17,969
23.681147.8%9.0%(-1.21)#2559.6%(-1.83)#18,782
24.681047.5%9.0%(-1.43)#2669.6%(-2.05)#19,526
25.681126.9%9.0%(-2.04)#2959.6%(-2.66)#21,351
26.681056.8%9.0%(-2.17)#3039.6%(-2.80)#21,724
27.681116.6%9.0%(-2.41)#3179.6%(-3.04)#22,290
28.681025.1%9.0%(-3.88)#3929.6%(-4.50)#25,408
29.681074.9%9.0%(-4.10)#4039.6%(-4.72)#25,786
30.681783.4%9.0%(-5.53)#4589.6%(-6.15)#27,705
31.681103.1%9.0%(-5.83)#4739.6%(-6.46)#28,018
32.681821.9%9.0%(-7.11)#5039.6%(-7.73)#29,055

Common Questions

What are the Top 10 Zip Codes with the Highest Percentage of Population Employed in Sales & Related in Omaha, NE?
Top 10 Zip Codes with the Highest Percentage of Population Employed in Sales & Related in Omaha, NE are:
#1
13.7%
#2
12.5%
#3
11.9%
#4
11.8%
#5
11.8%
#6
11.4%
#7
11.1%
#8
10.9%
#9
10.8%
#10
10.6%
What zip code has the Highest Percentage of Population Employed in Sales & Related in Omaha, NE?
68130 has the Highest Percentage of Population Employed in Sales & Related in Omaha, NE with 13.7%.
What is the Percentage of Population Employed in Sales & Related in Omaha, NE?
Percentage of Population Employed in Sales & Related in Omaha is 9.4%.
What is the Percentage of Population Employed in Sales & Related in Nebraska?
Percentage of Population Employed in Sales & Related in Nebraska is 9.0%.
What is the Percentage of Population Employed in Sales & Related in the United States?
Percentage of Population Employed in Sales & Related in the United States is 9.6%.