Zip Codes with the Highest Percentage of Population Employed in Professional & Scientific Services in Omaha, NE

RELATED REPORTS & OPTIONS

Professional & Scientific Services
Population
Families and Households
Female Fertility
Female Fertility (Unmarried)
Race (Community Size)
Race (Percentage)
Ancestry (Community Size)
AfghanAfricanAlbanianAleutAmericanApacheArabArapahoArgentineanArmenianAustralianAustrianBangladeshiBasqueBelgianBhutaneseBlackfeetBolivianBrazilianBritishBulgarianBurmeseCajunCambodianCanadianCarpatho RusynCentral AmericanCentral American IndianCherokeeChickasawChileanChineseChippewaChoctawColombianComancheCosta RicanCreekCroatianCubanCzechCzechoslovakianDanishDominicanDutchEastern EuropeanEcuadorianEgyptianEnglishEthiopianEuropeanFilipinoFinnishFrenchFrench American IndianFrench CanadianGermanGerman RussianGhanaianGreekGuamanian / ChamorroGuatemalanGuyaneseHaitianHonduranHungarianIcelanderIndian (Asian)IndonesianInupiatIranianIraqiIrishIroquoisIsraeliItalianJamaicanJapaneseJordanianKenyanKiowaKoreanLaotianLatvianLebaneseLithuanianLuxembourgerMacedonianMalaysianMexicanMexican American IndianMoroccanNative HawaiianNavajoNicaraguanNigerianNorthern EuropeanNorwegianPakistaniPalestinianPanamanianPennsylvania GermanPeruvianPolishPortuguesePotawatomiPuebloPuerto RicanRomanianRussianSalvadoranSamoanScandinavianScotch-IrishScottishSeminoleSerbianSiouxSlavicSlovakSloveneSomaliSouth AfricanSouth AmericanSpaniardSpanishSri LankanSubsaharan AfricanSudaneseSwedishSwissSyrianThaiTlingit-HaidaTrinidadian and TobagonianTurkishUkrainianVenezuelanVietnameseWelshWest IndianYugoslavianZimbabwean
Ancestry (Percentage)
AfghanAfricanAlbanianAleutAmericanApacheArabArapahoArgentineanArmenianAustralianAustrianBangladeshiBasqueBelgianBhutaneseBlackfeetBolivianBrazilianBritishBulgarianBurmeseCajunCambodianCanadianCarpatho RusynCentral AmericanCentral American IndianCherokeeChickasawChileanChineseChippewaChoctawColombianComancheCosta RicanCreekCroatianCubanCzechCzechoslovakianDanishDominicanDutchEastern EuropeanEcuadorianEgyptianEnglishEthiopianEuropeanFilipinoFinnishFrenchFrench American IndianFrench CanadianGermanGerman RussianGhanaianGreekGuamanian / ChamorroGuatemalanGuyaneseHaitianHonduranHungarianIcelanderIndian (Asian)IndonesianInupiatIranianIraqiIrishIroquoisIsraeliItalianJamaicanJapaneseJordanianKenyanKiowaKoreanLaotianLatvianLebaneseLithuanianLuxembourgerMacedonianMalaysianMexicanMexican American IndianMoroccanNative HawaiianNavajoNicaraguanNigerianNorthern EuropeanNorwegianPakistaniPalestinianPanamanianPennsylvania GermanPeruvianPolishPortuguesePotawatomiPuebloPuerto RicanRomanianRussianSalvadoranSamoanScandinavianScotch-IrishScottishSeminoleSerbianSiouxSlavicSlovakSloveneSomaliSouth AfricanSouth AmericanSpaniardSpanishSri LankanSubsaharan AfricanSudaneseSwedishSwissSyrianThaiTlingit-HaidaTrinidadian and TobagonianTurkishUkrainianVenezuelanVietnameseWelshWest IndianYugoslavianZimbabwean
Immigrant Origin (Total)
AfghanistanAfricaArgentinaAsiaAustraliaBangladeshBarbadosBelarusBosnia and HerzegovinaBrazilBurma / MyanmarCameroonCanadaCaribbeanCentral AmericaChileChinaColombiaCongoCosta RicaCroatiaCubaCzechoslovakiaDominican RepublicEastern AfricaEastern AsiaEastern EuropeEgyptEl SalvadorEnglandEthiopiaEuropeFranceGermanyGhanaGreeceGuatemalaHondurasHong KongHungaryIndiaIndonesiaIranIraqIrelandIsraelItalyJamaicaJapanJordanKazakhstanKenyaKoreaKuwaitLaosLatin AmericaLatviaLithuaniaMalaysiaMexicoMiddle AfricaMoroccoNepalNetherlandsNicaraguaNigeriaNorthern AfricaNorthern EuropeOceaniaPakistanPanamaPeruPhilippinesPolandPortugalRomaniaRussiaSaudi ArabiaScotlandSierra LeoneSomaliaSouth AfricaSouth AmericaSouth Central AsiaSouth Eastern AsiaSouthern EuropeSpainSri LankaSudanSyriaTaiwanThailandTrinidad and TobagoTurkeyUgandaUkraineVenezuelaVietnamWestern AfricaWestern AsiaWestern EuropeZaireZimbabwe
Immigrant Origin (Percentage)
AfghanistanAfricaArgentinaAsiaAustraliaBangladeshBarbadosBelarusBosnia and HerzegovinaBrazilBurma / MyanmarCameroonCanadaCaribbeanCentral AmericaChileChinaColombiaCongoCosta RicaCroatiaCubaCzechoslovakiaDominican RepublicEastern AfricaEastern AsiaEastern EuropeEgyptEl SalvadorEnglandEthiopiaEuropeFranceGermanyGhanaGreeceGuatemalaHondurasHong KongHungaryIndiaIndonesiaIranIraqIrelandIsraelItalyJamaicaJapanJordanKazakhstanKenyaKoreaKuwaitLaosLatin AmericaLatviaLithuaniaMalaysiaMexicoMiddle AfricaMoroccoNepalNetherlandsNicaraguaNigeriaNorthern AfricaNorthern EuropeOceaniaPakistanPanamaPeruPhilippinesPolandPortugalRomaniaRussiaSaudi ArabiaScotlandSierra LeoneSomaliaSouth AfricaSouth AmericaSouth Central AsiaSouth Eastern AsiaSouthern EuropeSpainSri LankaSudanSyriaTaiwanThailandTrinidad and TobagoTurkeyUgandaUkraineVenezuelaVietnamWestern AfricaWestern AsiaWestern EuropeZaireZimbabwe
Income
Income (Families)
Income (Households)
Poverty
Poverty (Families)
Unemployment
Employment Occupations
Employment Industries
Employer Class
Commute Time
Commute Means
School Enrollment
Education by Degree Field
Occupancy
Finances
Physical Characteristics
Omaha
Compare Zip Codes
Comparison Subject

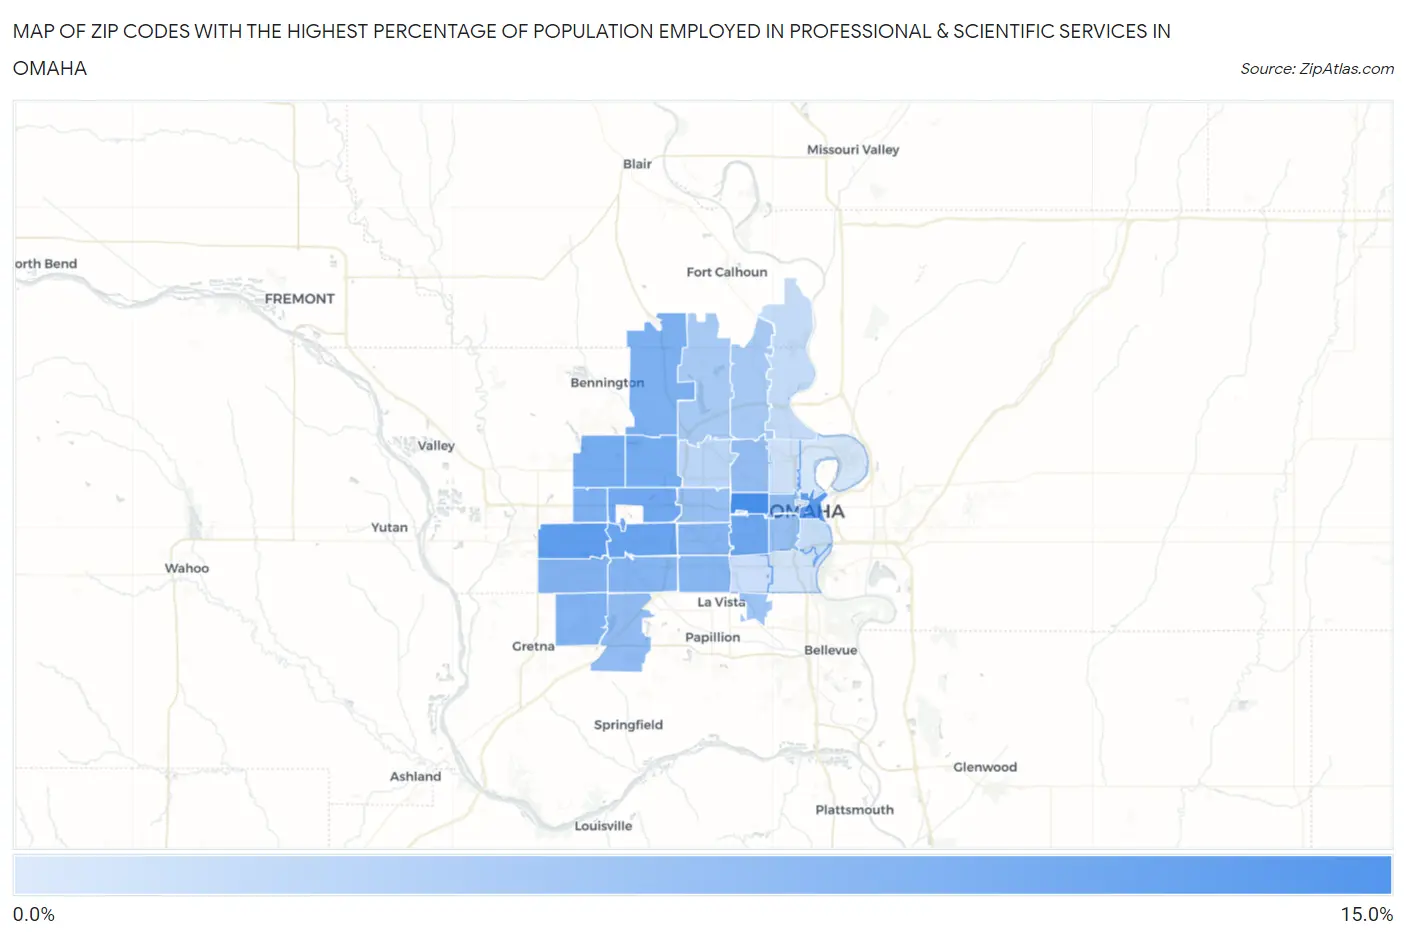
Map of Zip Codes with the Highest Percentage of Population Employed in Professional & Scientific Services in Omaha

0.0%
15.0%
Zip Codes with the Highest Percentage of Population Employed in Professional & Scientific Services in Omaha Map

Zip Codes with the Highest Percentage of Population Employed in Professional & Scientific Services in Omaha, NE

Zip Code % Employed vs State vs National
1.6813214.1%5.7%(+8.38)#117.8%(+6.28)#2,226
2.6810212.4%5.7%(+6.67)#157.8%(+4.57)#2,984
3.6813011.8%5.7%(+6.06)#197.8%(+3.96)#3,318
4.6814411.0%5.7%(+5.26)#217.8%(+3.16)#3,830
5.6810610.6%5.7%(+4.87)#237.8%(+2.76)#4,096
6.6815410.5%5.7%(+4.75)#247.8%(+2.64)#4,198
7.6811610.2%5.7%(+4.44)#287.8%(+2.33)#4,444
8.6816410.1%5.7%(+4.38)#307.8%(+2.28)#4,488
9.681429.6%5.7%(+3.83)#357.8%(+1.73)#4,937
10.681189.3%5.7%(+3.58)#377.8%(+1.47)#5,166
11.681369.0%5.7%(+3.29)#407.8%(+1.19)#5,479
12.681359.0%5.7%(+3.24)#427.8%(+1.14)#5,543
13.681378.8%5.7%(+3.04)#447.8%(+0.942)#5,712
14.681248.8%5.7%(+3.03)#457.8%(+0.928)#5,733
15.681278.5%5.7%(+2.74)#477.8%(+0.638)#6,034
16.681318.0%5.7%(+2.26)#527.8%(+0.155)#6,655
17.681387.8%5.7%(+2.04)#577.8%(-0.066)#6,953
18.681047.7%5.7%(+1.91)#587.8%(-0.190)#7,119
19.681057.4%5.7%(+1.65)#647.8%(-0.457)#7,512
20.681147.1%5.7%(+1.36)#717.8%(-0.745)#7,994
21.681576.5%5.7%(+0.785)#857.8%(-1.32)#8,986
22.681826.1%5.7%(+0.372)#937.8%(-1.73)#9,748
23.681225.9%5.7%(+0.136)#997.8%(-1.97)#10,210
24.681525.9%5.7%(+0.130)#1007.8%(-1.97)#10,216
25.681344.4%5.7%(-1.34)#1637.8%(-3.44)#13,939
26.681123.6%5.7%(-2.11)#1987.8%(-4.21)#16,243
27.681083.5%5.7%(-2.28)#2067.8%(-4.38)#16,856
28.681173.0%5.7%(-2.77)#2357.8%(-4.88)#18,533
29.681112.6%5.7%(-3.13)#2597.8%(-5.23)#19,778
30.681072.5%5.7%(-3.27)#2757.8%(-5.38)#20,281
31.681102.1%5.7%(-3.65)#3077.8%(-5.76)#21,591
32.681781.6%5.7%(-4.18)#3537.8%(-6.28)#23,325

Common Questions

What are the Top 10 Zip Codes with the Highest Percentage of Population Employed in Professional & Scientific Services in Omaha, NE?
Top 10 Zip Codes with the Highest Percentage of Population Employed in Professional & Scientific Services in Omaha, NE are:
#1
14.1%
#2
12.4%
#3
11.8%
#4
11.0%
#5
10.6%
#6
10.5%
#7
10.2%
#8
10.1%
#9
9.6%
#10
9.3%
What zip code has the Highest Percentage of Population Employed in Professional & Scientific Services in Omaha, NE?
68132 has the Highest Percentage of Population Employed in Professional & Scientific Services in Omaha, NE with 14.1%.
What is the Percentage of Population Employed in Professional & Scientific Services in Omaha, NE?
Percentage of Population Employed in Professional & Scientific Services in Omaha is 8.1%.
What is the Percentage of Population Employed in Professional & Scientific Services in Nebraska?
Percentage of Population Employed in Professional & Scientific Services in Nebraska is 5.7%.
What is the Percentage of Population Employed in Professional & Scientific Services in the United States?
Percentage of Population Employed in Professional & Scientific Services in the United States is 7.8%.