Zip Codes with the Highest Percentage of Population Employed in Construction & Extraction in Omaha, NE

RELATED REPORTS & OPTIONS

Construction & Extraction
Population
Families and Households
Female Fertility
Female Fertility (Unmarried)
Race (Community Size)
Race (Percentage)
Ancestry (Community Size)
AfghanAfricanAlbanianAleutAmericanApacheArabArapahoArgentineanArmenianAustralianAustrianBangladeshiBasqueBelgianBhutaneseBlackfeetBolivianBrazilianBritishBulgarianBurmeseCajunCambodianCanadianCarpatho RusynCentral AmericanCentral American IndianCherokeeChickasawChileanChineseChippewaChoctawColombianComancheCosta RicanCreekCroatianCubanCzechCzechoslovakianDanishDominicanDutchEastern EuropeanEcuadorianEgyptianEnglishEthiopianEuropeanFilipinoFinnishFrenchFrench American IndianFrench CanadianGermanGerman RussianGhanaianGreekGuamanian / ChamorroGuatemalanGuyaneseHaitianHonduranHungarianIcelanderIndian (Asian)IndonesianInupiatIranianIraqiIrishIroquoisIsraeliItalianJamaicanJapaneseJordanianKenyanKiowaKoreanLaotianLatvianLebaneseLithuanianLuxembourgerMacedonianMalaysianMexicanMexican American IndianMoroccanNative HawaiianNavajoNicaraguanNigerianNorthern EuropeanNorwegianPakistaniPalestinianPanamanianPennsylvania GermanPeruvianPolishPortuguesePotawatomiPuebloPuerto RicanRomanianRussianSalvadoranSamoanScandinavianScotch-IrishScottishSeminoleSerbianSiouxSlavicSlovakSloveneSomaliSouth AfricanSouth AmericanSpaniardSpanishSri LankanSubsaharan AfricanSudaneseSwedishSwissSyrianThaiTlingit-HaidaTrinidadian and TobagonianTurkishUkrainianVenezuelanVietnameseWelshWest IndianYugoslavianZimbabwean
Ancestry (Percentage)
AfghanAfricanAlbanianAleutAmericanApacheArabArapahoArgentineanArmenianAustralianAustrianBangladeshiBasqueBelgianBhutaneseBlackfeetBolivianBrazilianBritishBulgarianBurmeseCajunCambodianCanadianCarpatho RusynCentral AmericanCentral American IndianCherokeeChickasawChileanChineseChippewaChoctawColombianComancheCosta RicanCreekCroatianCubanCzechCzechoslovakianDanishDominicanDutchEastern EuropeanEcuadorianEgyptianEnglishEthiopianEuropeanFilipinoFinnishFrenchFrench American IndianFrench CanadianGermanGerman RussianGhanaianGreekGuamanian / ChamorroGuatemalanGuyaneseHaitianHonduranHungarianIcelanderIndian (Asian)IndonesianInupiatIranianIraqiIrishIroquoisIsraeliItalianJamaicanJapaneseJordanianKenyanKiowaKoreanLaotianLatvianLebaneseLithuanianLuxembourgerMacedonianMalaysianMexicanMexican American IndianMoroccanNative HawaiianNavajoNicaraguanNigerianNorthern EuropeanNorwegianPakistaniPalestinianPanamanianPennsylvania GermanPeruvianPolishPortuguesePotawatomiPuebloPuerto RicanRomanianRussianSalvadoranSamoanScandinavianScotch-IrishScottishSeminoleSerbianSiouxSlavicSlovakSloveneSomaliSouth AfricanSouth AmericanSpaniardSpanishSri LankanSubsaharan AfricanSudaneseSwedishSwissSyrianThaiTlingit-HaidaTrinidadian and TobagonianTurkishUkrainianVenezuelanVietnameseWelshWest IndianYugoslavianZimbabwean
Immigrant Origin (Total)
AfghanistanAfricaArgentinaAsiaAustraliaBangladeshBarbadosBelarusBosnia and HerzegovinaBrazilBurma / MyanmarCameroonCanadaCaribbeanCentral AmericaChileChinaColombiaCongoCosta RicaCroatiaCubaCzechoslovakiaDominican RepublicEastern AfricaEastern AsiaEastern EuropeEgyptEl SalvadorEnglandEthiopiaEuropeFranceGermanyGhanaGreeceGuatemalaHondurasHong KongHungaryIndiaIndonesiaIranIraqIrelandIsraelItalyJamaicaJapanJordanKazakhstanKenyaKoreaKuwaitLaosLatin AmericaLatviaLithuaniaMalaysiaMexicoMiddle AfricaMoroccoNepalNetherlandsNicaraguaNigeriaNorthern AfricaNorthern EuropeOceaniaPakistanPanamaPeruPhilippinesPolandPortugalRomaniaRussiaSaudi ArabiaScotlandSierra LeoneSomaliaSouth AfricaSouth AmericaSouth Central AsiaSouth Eastern AsiaSouthern EuropeSpainSri LankaSudanSyriaTaiwanThailandTrinidad and TobagoTurkeyUgandaUkraineVenezuelaVietnamWestern AfricaWestern AsiaWestern EuropeZaireZimbabwe
Immigrant Origin (Percentage)
AfghanistanAfricaArgentinaAsiaAustraliaBangladeshBarbadosBelarusBosnia and HerzegovinaBrazilBurma / MyanmarCameroonCanadaCaribbeanCentral AmericaChileChinaColombiaCongoCosta RicaCroatiaCubaCzechoslovakiaDominican RepublicEastern AfricaEastern AsiaEastern EuropeEgyptEl SalvadorEnglandEthiopiaEuropeFranceGermanyGhanaGreeceGuatemalaHondurasHong KongHungaryIndiaIndonesiaIranIraqIrelandIsraelItalyJamaicaJapanJordanKazakhstanKenyaKoreaKuwaitLaosLatin AmericaLatviaLithuaniaMalaysiaMexicoMiddle AfricaMoroccoNepalNetherlandsNicaraguaNigeriaNorthern AfricaNorthern EuropeOceaniaPakistanPanamaPeruPhilippinesPolandPortugalRomaniaRussiaSaudi ArabiaScotlandSierra LeoneSomaliaSouth AfricaSouth AmericaSouth Central AsiaSouth Eastern AsiaSouthern EuropeSpainSri LankaSudanSyriaTaiwanThailandTrinidad and TobagoTurkeyUgandaUkraineVenezuelaVietnamWestern AfricaWestern AsiaWestern EuropeZaireZimbabwe
Income
Income (Families)
Income (Households)
Poverty
Poverty (Families)
Unemployment
Employment Occupations
Employment Industries
Employer Class
Commute Time
Commute Means
School Enrollment
Education by Degree Field
Occupancy
Finances
Physical Characteristics
Omaha
Compare Zip Codes
Comparison Subject

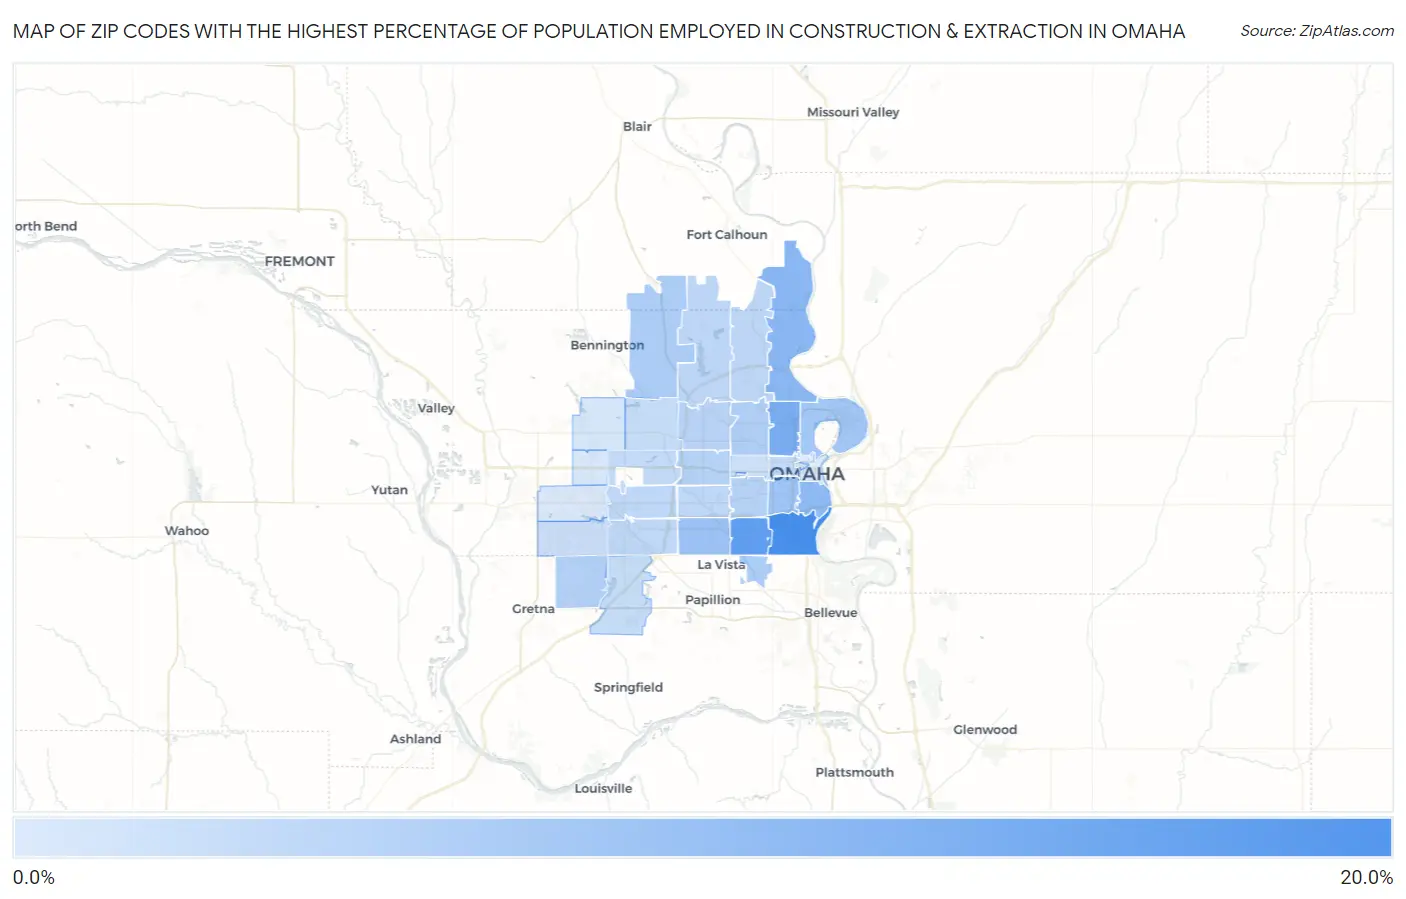
Map of Zip Codes with the Highest Percentage of Population Employed in Construction & Extraction in Omaha

0.0%
20.0%
Zip Codes with the Highest Percentage of Population Employed in Construction & Extraction in Omaha Map

Zip Codes with the Highest Percentage of Population Employed in Construction & Extraction in Omaha, NE

Zip Code % Employed vs State vs National
1.6810715.7%5.2%(+10.5)#165.0%(+10.7)#1,786
2.6811713.1%5.2%(+7.82)#345.0%(+8.07)#2,898
3.6811110.6%5.2%(+5.38)#695.0%(+5.64)#4,724
4.681129.0%5.2%(+3.78)#955.0%(+4.03)#6,721
5.681088.6%5.2%(+3.38)#1115.0%(+3.63)#7,367
6.681277.3%5.2%(+2.00)#1545.0%(+2.26)#10,094
7.681057.2%5.2%(+1.94)#1565.0%(+2.19)#10,270
8.681106.7%5.2%(+1.41)#1795.0%(+1.67)#11,597
9.681425.9%5.2%(+0.608)#2245.0%(+0.864)#13,910
10.681575.7%5.2%(+0.494)#2295.0%(+0.750)#14,248
11.681045.7%5.2%(+0.456)#2335.0%(+0.712)#14,368
12.681365.2%5.2%(-0.081)#2635.0%(+0.175)#16,157
13.681144.9%5.2%(-0.303)#2815.0%(-0.048)#16,952
14.681064.9%5.2%(-0.360)#2865.0%(-0.104)#17,151
15.681344.9%5.2%(-0.392)#2915.0%(-0.136)#17,251
16.681224.3%5.2%(-0.925)#3325.0%(-0.670)#19,130
17.681524.3%5.2%(-0.929)#3335.0%(-0.673)#19,143
18.681444.2%5.2%(-1.04)#3405.0%(-0.783)#19,559
19.681374.2%5.2%(-1.06)#3435.0%(-0.801)#19,633
20.681244.1%5.2%(-1.17)#3505.0%(-0.916)#20,037
21.681313.9%5.2%(-1.32)#3615.0%(-1.06)#20,594
22.681543.8%5.2%(-1.47)#3765.0%(-1.22)#21,091
23.681383.6%5.2%(-1.64)#3865.0%(-1.39)#21,653
24.681643.4%5.2%(-1.83)#4015.0%(-1.57)#22,256
25.681353.0%5.2%(-2.23)#4305.0%(-1.97)#23,530
26.681322.9%5.2%(-2.32)#4385.0%(-2.07)#23,801
27.681782.5%5.2%(-2.74)#4625.0%(-2.49)#25,027
28.681162.1%5.2%(-3.19)#4815.0%(-2.94)#26,185
29.681181.8%5.2%(-3.41)#4895.0%(-3.16)#26,704
30.681301.6%5.2%(-3.66)#4965.0%(-3.40)#27,227
31.681021.4%5.2%(-3.82)#5035.0%(-3.57)#27,581

Common Questions

What are the Top 10 Zip Codes with the Highest Percentage of Population Employed in Construction & Extraction in Omaha, NE?
Top 10 Zip Codes with the Highest Percentage of Population Employed in Construction & Extraction in Omaha, NE are:
#1
15.7%
#2
13.1%
#3
10.6%
#4
9.0%
#5
8.6%
#6
7.3%
#7
7.2%
#8
6.7%
#9
5.9%
#10
5.7%
What zip code has the Highest Percentage of Population Employed in Construction & Extraction in Omaha, NE?
68107 has the Highest Percentage of Population Employed in Construction & Extraction in Omaha, NE with 15.7%.
What is the Percentage of Population Employed in Construction & Extraction in Omaha, NE?
Percentage of Population Employed in Construction & Extraction in Omaha is 5.3%.
What is the Percentage of Population Employed in Construction & Extraction in Nebraska?
Percentage of Population Employed in Construction & Extraction in Nebraska is 5.2%.
What is the Percentage of Population Employed in Construction & Extraction in the United States?
Percentage of Population Employed in Construction & Extraction in the United States is 5.0%.