Zip Codes with the Highest Percentage of Population Employed in Farming, Fishing & Forestry in Grand Island, NE
RELATED REPORTS & OPTIONS
Farming, Fishing & Forestry
Grand Island
Compare Zip Codes
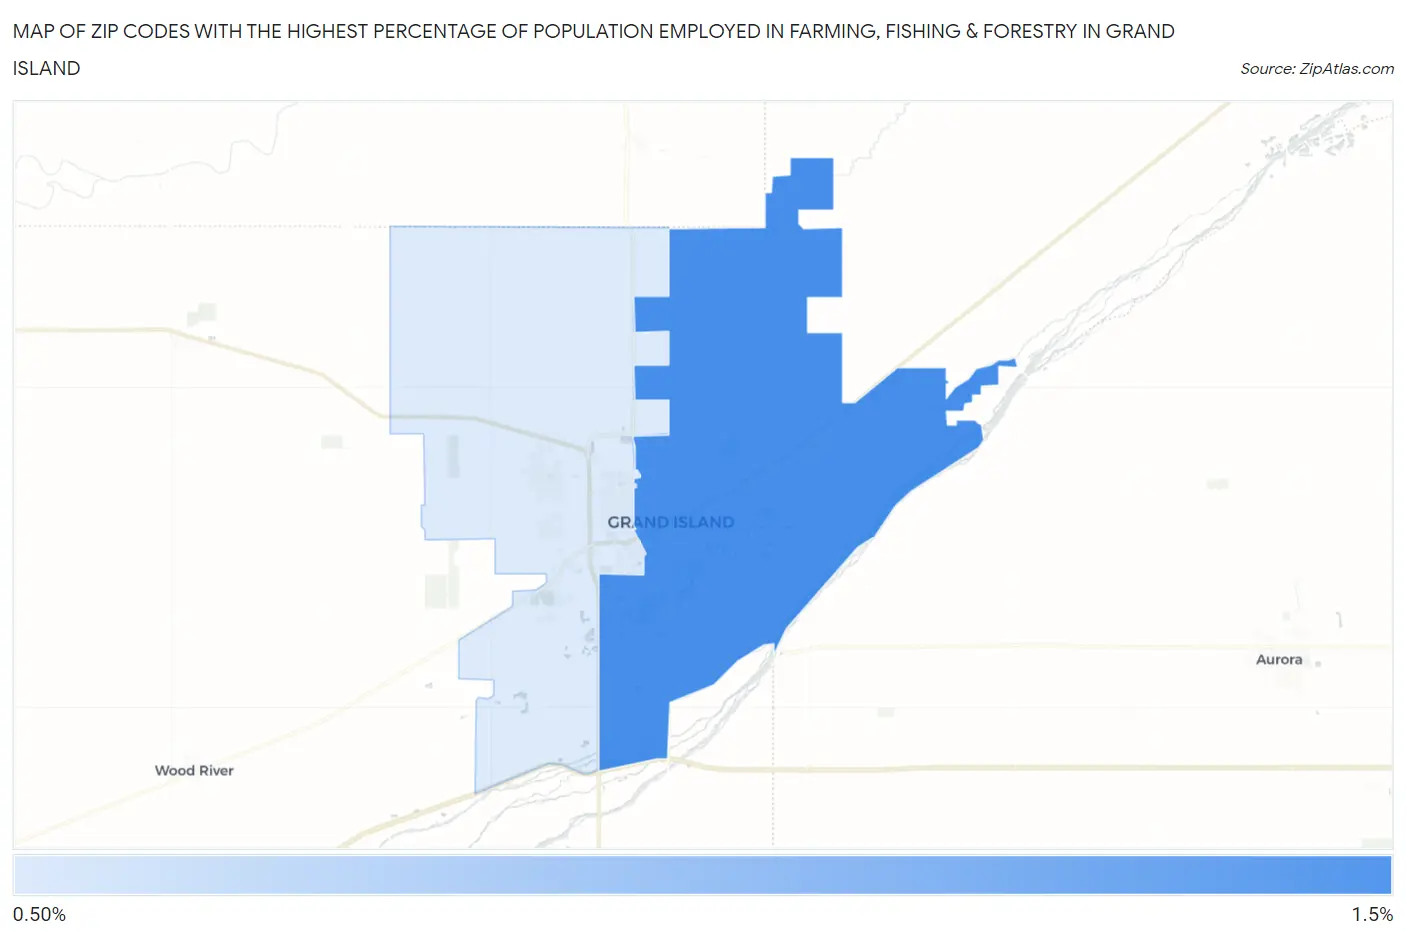
Map of Zip Codes with the Highest Percentage of Population Employed in Farming, Fishing & Forestry in Grand Island
0.0%
1.5%
Zip Codes with the Highest Percentage of Population Employed in Farming, Fishing & Forestry in Grand Island, NE
| Zip Code | % Employed | vs State | vs National | |
| 1. | 68801 | 1.1% | 1.3%(-0.194)#375 | 0.61%(+0.521)#9,213 |
| 2. | 68803 | 0.77% | 1.3%(-0.548)#406 | 0.61%(+0.167)#10,950 |
1
Common Questions
What are the Top Zip Codes with the Highest Percentage of Population Employed in Farming, Fishing & Forestry in Grand Island, NE?
Top Zip Codes with the Highest Percentage of Population Employed in Farming, Fishing & Forestry in Grand Island, NE are:
What zip code has the Highest Percentage of Population Employed in Farming, Fishing & Forestry in Grand Island, NE?
68801 has the Highest Percentage of Population Employed in Farming, Fishing & Forestry in Grand Island, NE with 1.1%.
What is the Percentage of Population Employed in Farming, Fishing & Forestry in Grand Island, NE?
Percentage of Population Employed in Farming, Fishing & Forestry in Grand Island is 0.96%.
What is the Percentage of Population Employed in Farming, Fishing & Forestry in Nebraska?
Percentage of Population Employed in Farming, Fishing & Forestry in Nebraska is 1.3%.
What is the Percentage of Population Employed in Farming, Fishing & Forestry in the United States?
Percentage of Population Employed in Farming, Fishing & Forestry in the United States is 0.61%.